Interpretation of the thesis (2): R-CNN
Interpretation of the thesis (2): R-CNN
The first time I learned the R-CNN paper. Because R-CNN is already an old algorithm, it didn't take the time to read the full text. It mainly read the contents of the first three chapters and the knowledge of Bounding-box regression. I have a little understanding of the idea and structure of R-CNN, and related details.
Original link: https://arxiv.org/abs/1311.2524
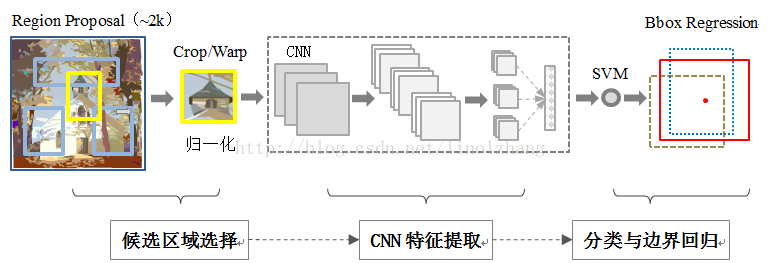
Algorithmic overall architecture
- Region proposals. Through the Selective Search method, a series of Region proposals of different sizes and different ratios are generated on the original image, and about 2000 suggestion windows are generated for each image. At the same time, because the size of the Region proposal is different, the content of the Region proposal needs to be warp (stretched) to a fixed size of 227*227;
- CNN feature extraction. Feature extraction is performed on the image through a CNN of 5 layers conv layer + 2 layers fn layer;
- SVM classification. The feature vectors generated by each suggestion window are classified and scored by a linear SVM classifier;
- Bounding-box regression. Perform linear regression training on the window to obtain the regression weight, and use this weight to offset and scale the proposed window. Thereby obtaining the final window;
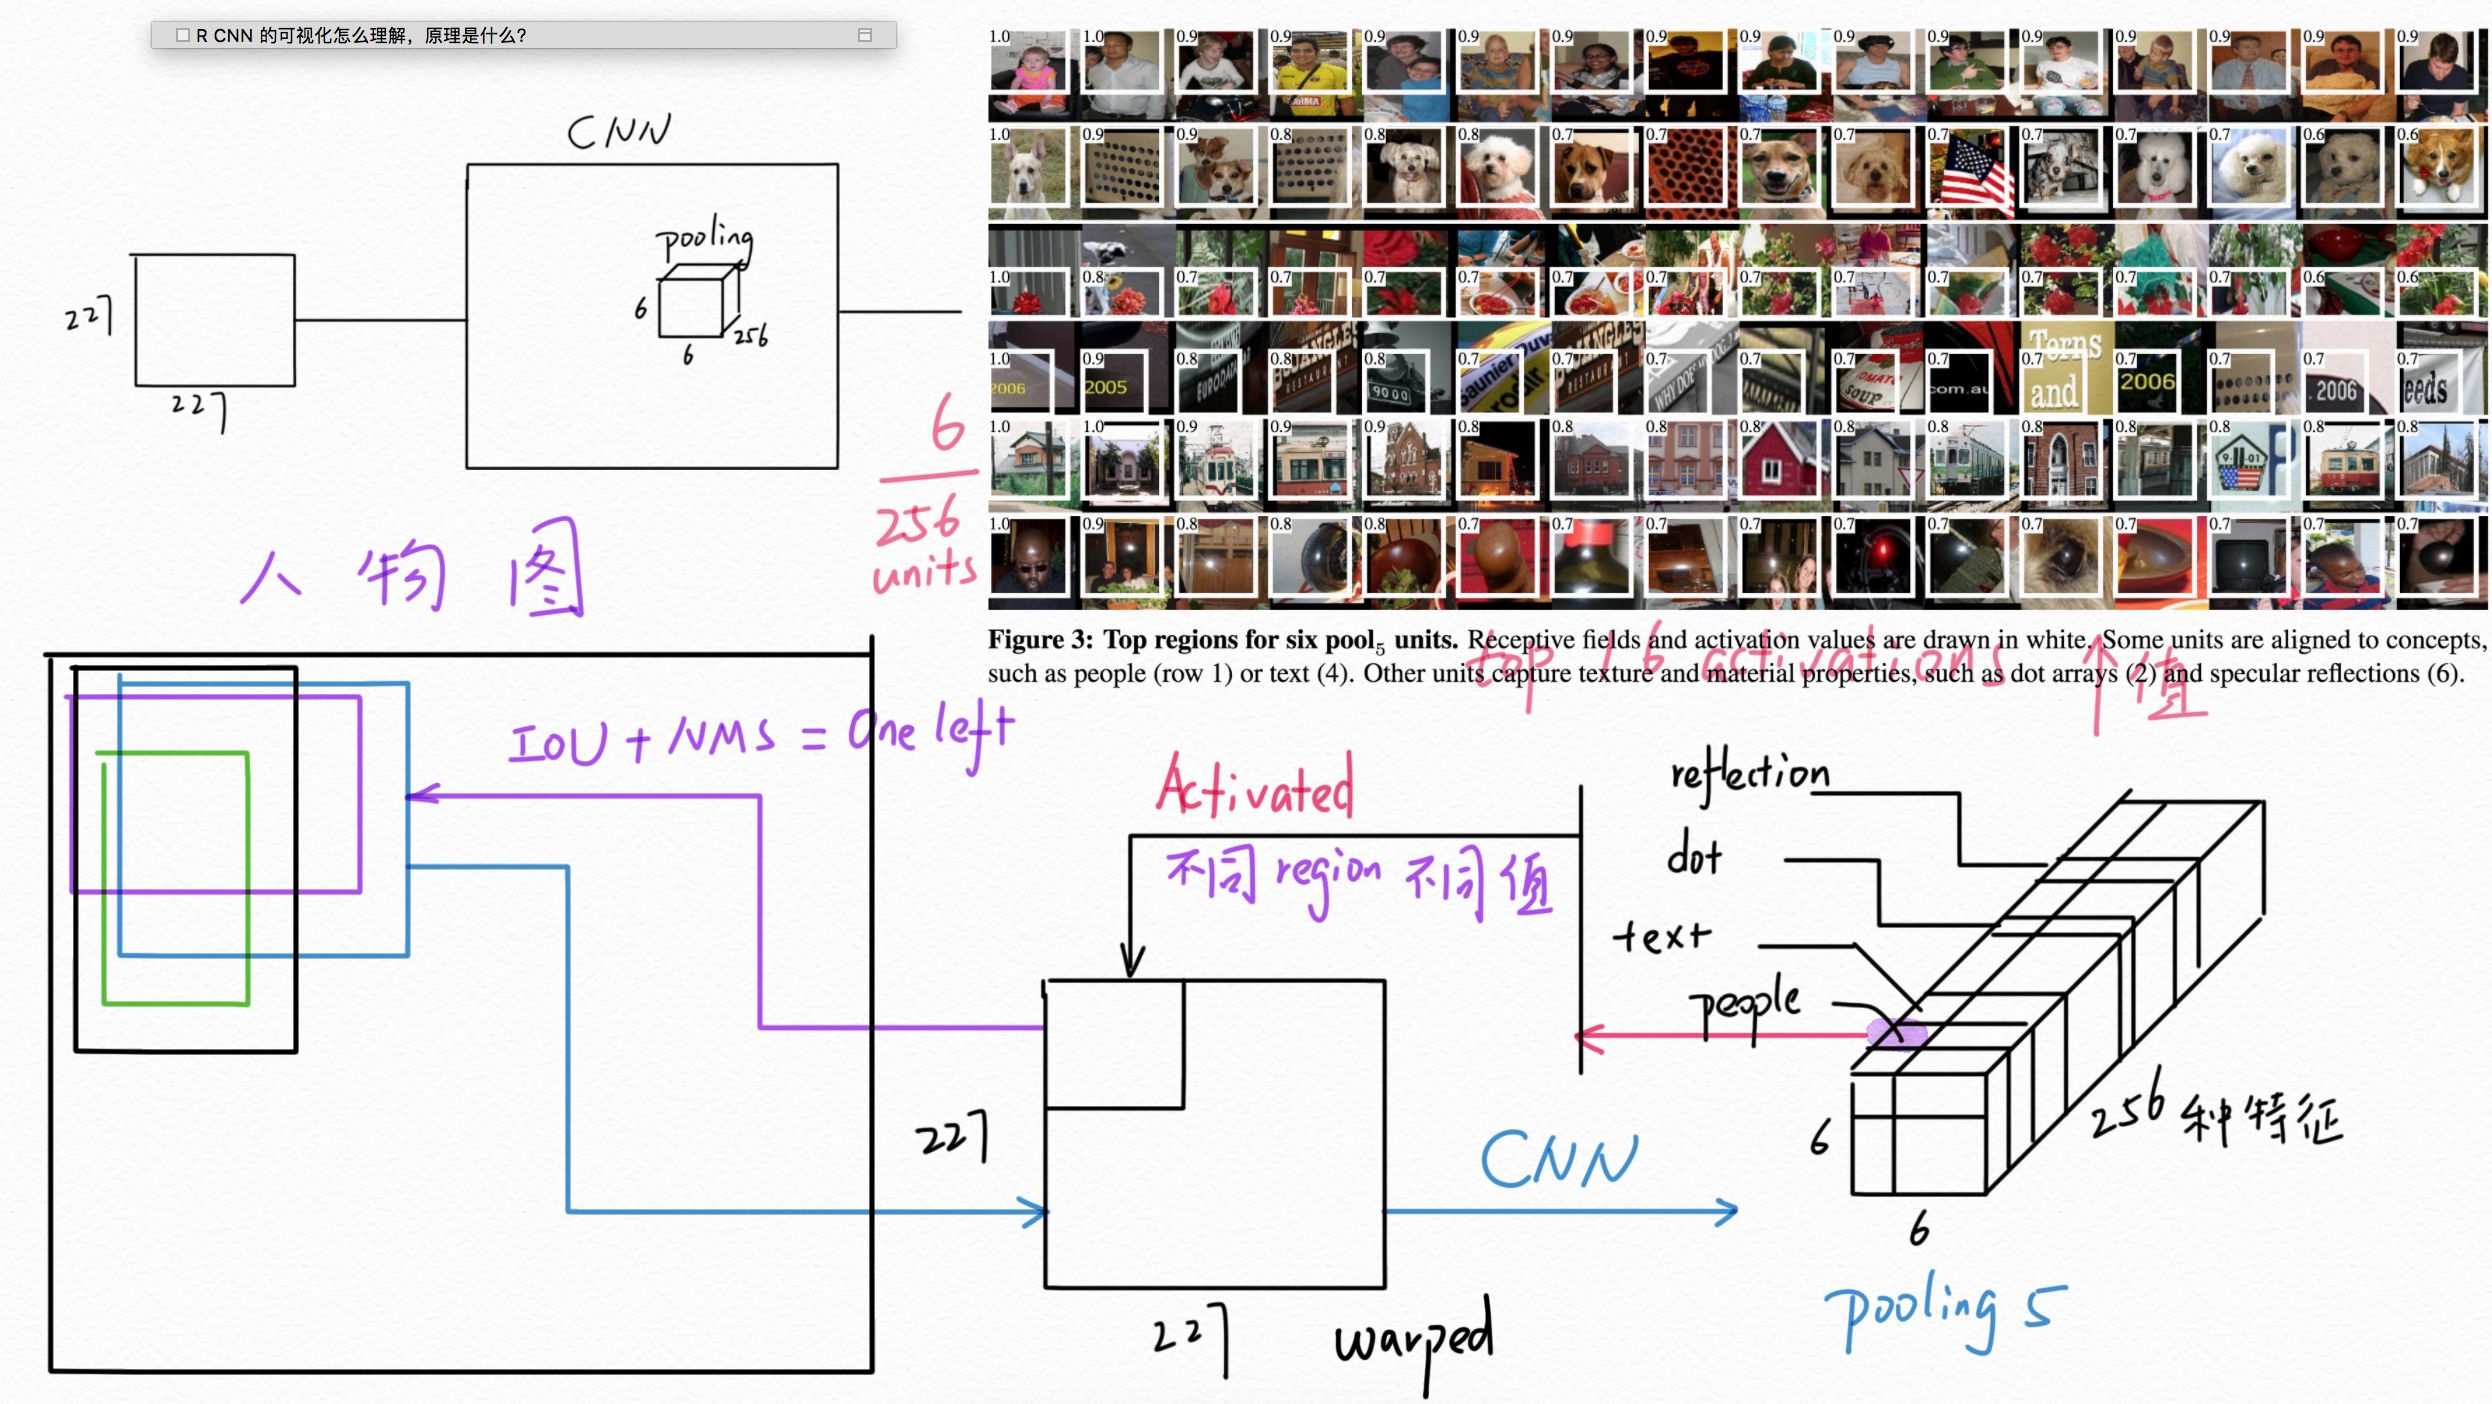
- Take non-maximum suppression (NMS). According to the scoring and IoU screening, the window after NMS is obtained.

Defects in the algorithm
1. Although the CNN parameters in the algorithm can be shared in all categories, since the recommendation window is generated first, it is equivalent to generating a large number of sub-pictures for each picture. These sub-pictures are input into the CNN for training, and the calculation amount is large. low efficiency.
2. Since the size of the Region proposals is different, it is necessary to form a size of the fixed size. Image distortion occurs during this process.
Details to be aware of in the algorithm
-
The only specific class-specific calculations mentioned in the paper are point multiplication and NMS between features map and SVM weights. This means that the weights of the SVM are not shared. Each class has a separate SVM. It can be seen from the overall structure diagram of the algorithm that all regions generated by one image share a CNN, but each SVM and Box. The regression is independent of the category.
-
Some methods that can improve the algorithm mAP are mentioned in the algorithm. Among the more useful ones are:
- Bounding-box regression。
- Use pool5 layer or fc6 or fc7 calculations. Explain that the output of different layers will affect the mAP, but the representation ability of the CNN layer mainly comes from the convolution layer, not the fully connected layer that occupies a large number of parameters.
- Adopt different CNN network architectures.
- Different IoU parameters are used. The paper takes 0.3, the value range is {0,0.1,...,0.5} {0, 0.1, ..., 0.5}{0,0.1,...,0.5}, the effect of 0.3 can achieve the best mAP
- Use fine-tuning. The use of fine-tuning can significantly improve the mAP of the model.
-
For each SGD iteration, mini-batch contains 32 positive boxes (including all categories) and 96 background boxes, mini-batch size=128.
Several key technologies involved in the algorithm
Selective Search
Selective search is used to generate about 2000 candidate regions for a single image. Its goal is to reduce the amount of computation by reducing the number of redundant candidate areas caused by sliding windows or exhaustive methods. This part of the content has been mentioned slightly before, the implementation is not manually implemented, the direct call to Selective Search can be achieved through pip installation.
Bounding box regression
The content of this part mainly refers to the original text, and Wang Bin _ICT's answer.
The purpose of this section is to fine-tune the regions produced in Selective Search to make the border closer to the real border. It is equivalent to making a regression between the proposed area and the original area.
The main idea is:
1. For each region, the corresponding activation map is calculated by CNN, which represents the proposed region.
2. The tensor of the activation map is resized to get the representation of the original area.
This value is then multiplied by the weight matrix W to obtain a representation of the original region P.
. Such a representation is actually a transformation of the original coordinates.
The 5 here represents 5th conv
3 through this
The regression calculation is performed on the coordinates of the real region G and the transformation of the proposed region coordinates to learn the weight matrix W.
Through this process, you can see that the input of the regression is P (including the features corresponding to P and the coordinates used to calculate the transformation) and G (coordinates), and the output is W.
The specific ideas of Bounding box regression are not described in detail, and there are detailed explanations in the papers and links.
Non-Maximum Suppression (NMS)
This part of the content mainly refers to the blog, the original: Kang Xing Tianxia
The purpose of this technique is to select the highest score window for many intersecting sliding windows and suppress other low score and high overlap windows through IoU. For example, in the target detection process, there may be many windows around an object, then you need to select the window with the highest score and remove other windows with high IoU; when you remove all the windows larger than the IoU threshold, select the score again. High windows for IoU screening.
Typical training and prediction process of the algorithm
Training process
- Enter a picture of the actual box position in the known picture and the category within the box;
- Generate a proposed area by Selective Search;
- According to the IoU of the proposed area and the real area in the image, the real category of the area can be determined, that is, the label in the frame is first labeled with its own;
- Extract mini-batch according to mini-batch size;
- For each mini-batch, fn7 is generated by the fine-tune CNN or CNN, and the flatten is multiplied by the parameters of the SVM to obtain a score, and the loss function is determined according to the real category;
- At the same time, the pool5 feature generated by CNN and the real box G coordinate are used to find the loss function of the category box regression;
- Adjust the parameters in 4 and 5 by backprop;
- Complete the training, get the shared CNN parameters, and the Bbox regression parameters corresponding to different categories;
- Perform non-maximum suppression, reduce the number of boxes, and get the final box and box categories.
Forecasting process
1. Take a picture and generate the proposed area through Selective Search;
2. For each proposed area, train through trained CNN and SVM to predict the category of the proposed area;
3. Adjust the area box by the Bbox regression parameter corresponding to the category. This step is not synchronized with the SVM during the training process, because the training process knows the category, but in the prediction process. In order to use the SVM to determine the category, in order to use the corresponding category
4. Use non-maximum suppression to reduce the number of frames in the entire image.
Intelligent Recommendation
Face R-CNN paper interpretation
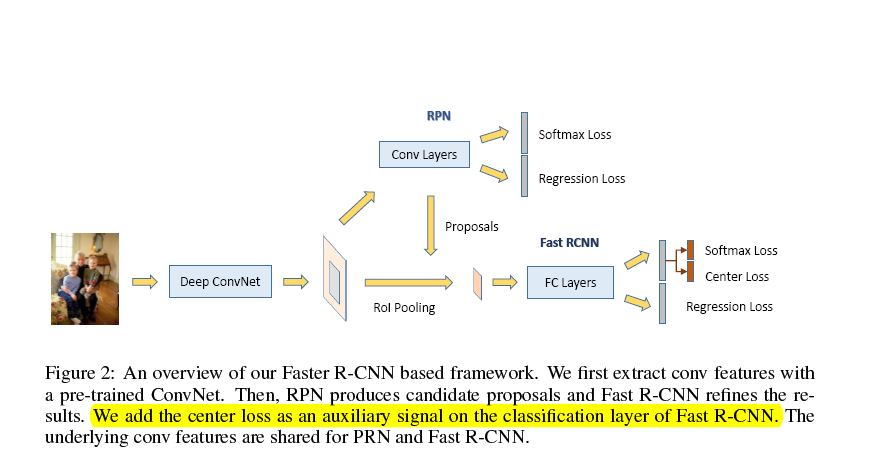
Network structure: This article made some improvements based on faster rcnn: First, based on a newly developed loss function called center loss [33], we design a new multi-task loss function in the Fa...
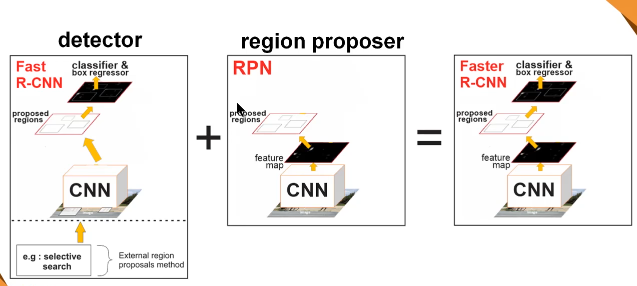
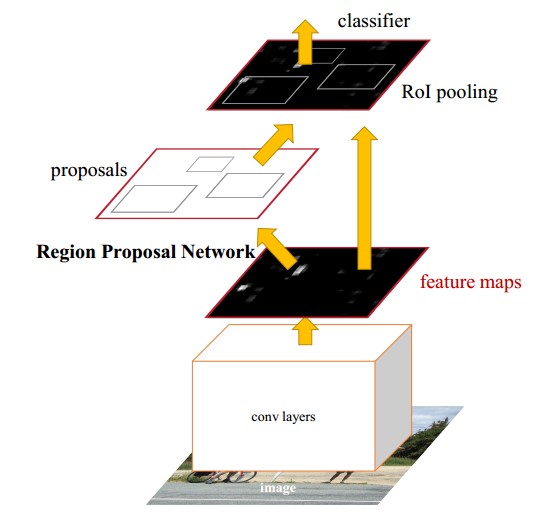
Interpretation of Faster R-CNN series
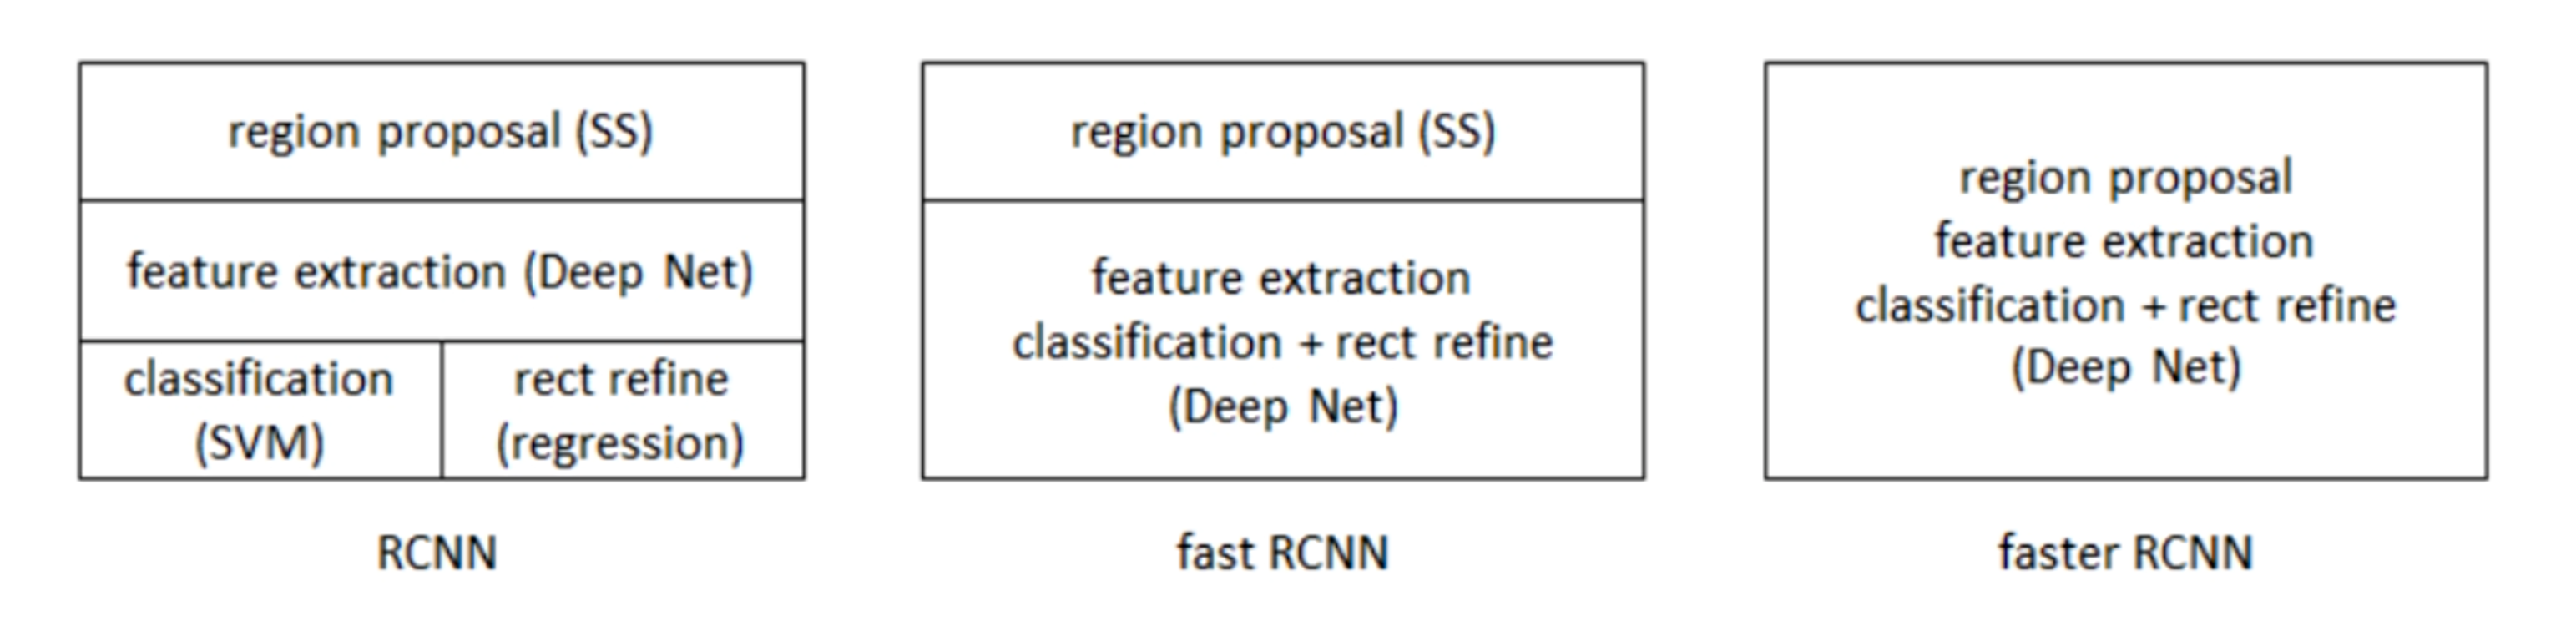
R-CNN is a series of tutorials, and Faster R-CNN has made a qualitative breakthrough. Let's take a look at the difference between them. From RCNN to fast RCNN, to the faster RCNN in this paper, the fo...
Cascade R-CNN detailed interpretation
Original link:Cascade R-CNN detailed interpretation The purpose of writing this article is to analyze the original text and help you understand the essence of the article. If there are errors, I hope ...
Interpretation of FASTER R-CNN Papers
Article catalog Abstract Introduction reason RPN Training program Faster R-CNN Overall process Conv layers RPN cls reg anchor Translation-Invariant Anchors Muti-Scale Anchors as Regression References ...
2.R-CNN
R-CNN CVPR2014 1. Advantages and disadvantages advantage: The first application of CNN to target detection is a milestone in the application of CNN to target detection. &...
More Recommendation
R-CNN Papers (2)
Question 1: What is the reason for the fine-tuning phase and the SVM stage threshold? The fine-tuning phase is due to the prefacience of CNN to small samples, requires a lot of training data, so the I...
Target Detection (2) - R-CNN, Fast R-CNN, Faster R-CNN, Mask R-CNN
R-CNN Regions of CNN features (R-CNN) use depth models to solve object recognition. Specific steps: Sective Search. Selective search is used for each input image to select multiple high quality offer ...
Faster R-CNN paper and source code interpretation
R-CNN is a very classic method in the field of target detection. Compared with traditional manual features, R-CNN introduces a convolutional neural network to extract depth features, followed by a cla...

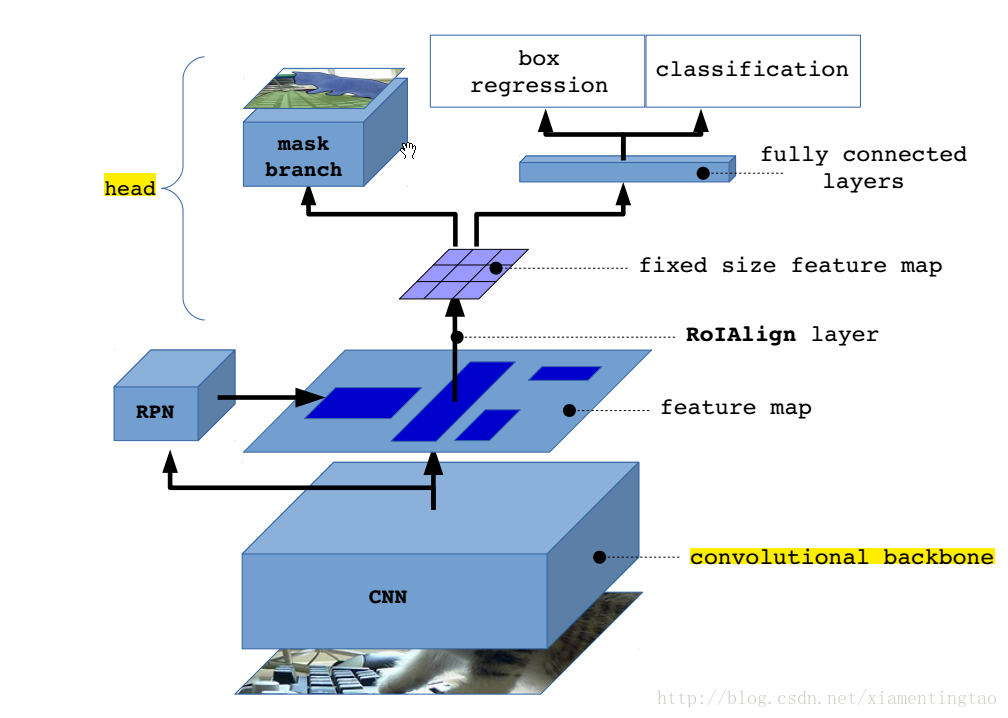
Detailed interpretation of Mask R-CNN principle
Mask R-CNN adds a branch to predict the split mask based on Faster R-CNN, as shown in the figure above. The black part is the original Faster-RCNN and the red part is the modification on the Faster-RC...

Better Mask R-CNN interpretation and code implementation
Interpretation: The difference between ROI Align and ROI Pooling:http://blog.leanote.com/post/[email protected]/b5f4f526490b ROI Align code:https://github.com/katotetsuro/roi_align/b...