Thesis interpretation: Graph R-CNN for Scene Graph Generation (ECCV18)
tags: Machine learning Computer vision cv Scene map scene graph gcn
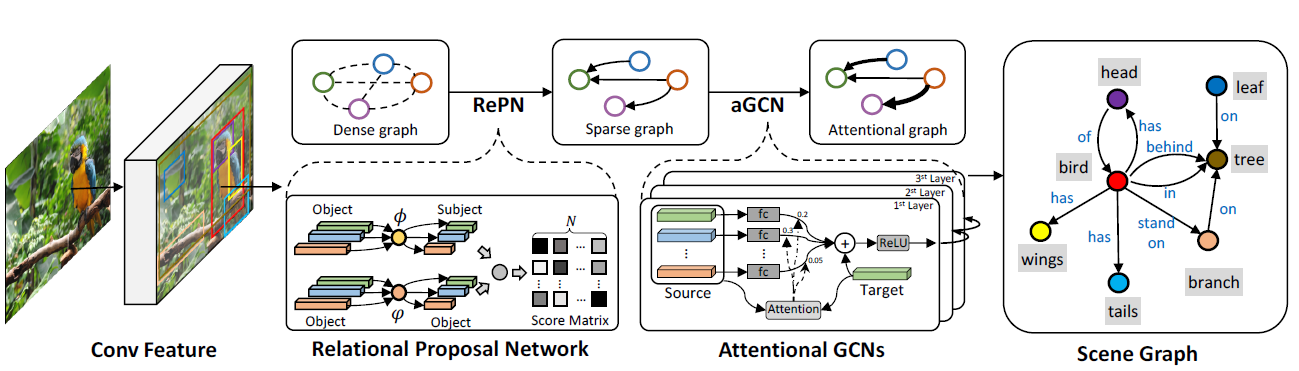
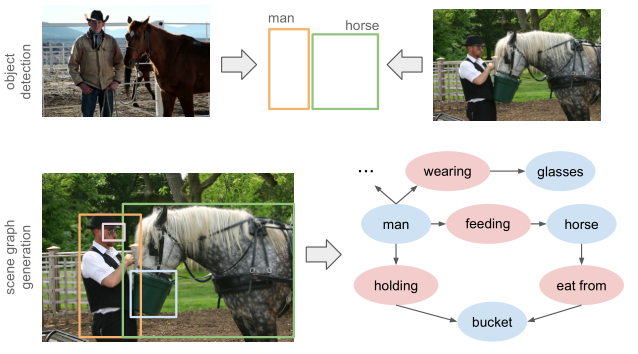
The Graph R-CNN model is divided into four parts:
(1)Target detection, Get proposals that may include targets
(2)RePN(Related Proposal Network): Relational PROPOSAL network.
The role of this network is to sparse the number of objects with complexity O (n), that is, pruning. (If the target detection network detects n proposal, then all possible objects are n*(n-1), that is, the complexity is O (n))
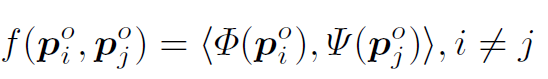
The REPN calculates the correlation of any pair of objects. Pi means the classification probability of the object (object) of the i -i node (object).
φ and are the mapping function (two layers of MLP). The probability of a pair of object classification is maximized, and the two are used as a matrix product to get the SCORE MATRIX. Then do NMS, and the remaining M is that the objects that are meaningful to be connected are right.
The reason why the classification probability is used as the basis of pruning is because some categories are difficult to interact with other categories.
(3)aGCN(Attention Graph Convolutional Network):
This is not clear (very unclear), I wrote it according to my own understanding.
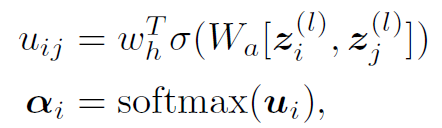
Attention calculation formula (attention of node I):
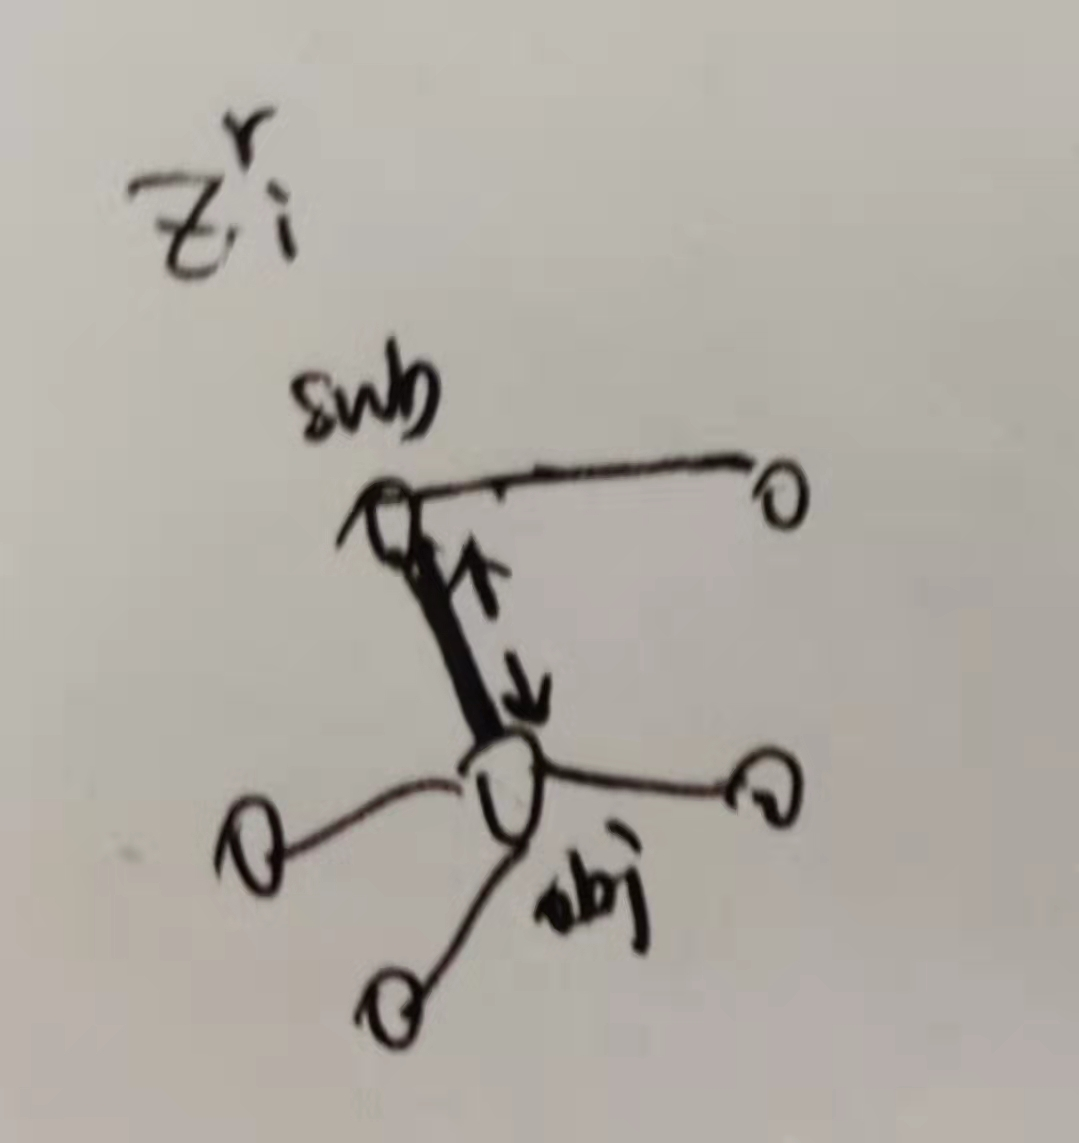
↓ This is a feature update formula for the relationship (edge):
The current relationship features come from the characteristics of the last characteristics of the previous itself and the two objects it contacted (ie, Subject and Object).
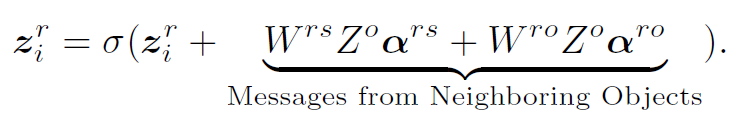
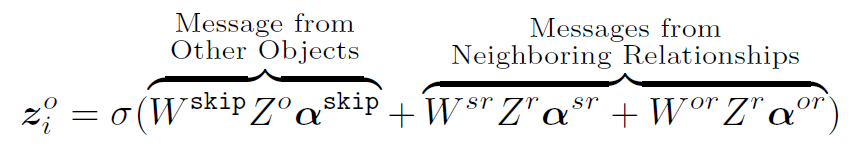
↓ This is the feature update formula of the node (object):
αSKIP represents Skip-Connection, which is available between all Object Node, which is newly added after the REPN. αskipii= 1 (The Attention of itself is 1), the remaining αSKIP should also be calculated according to the above attention.
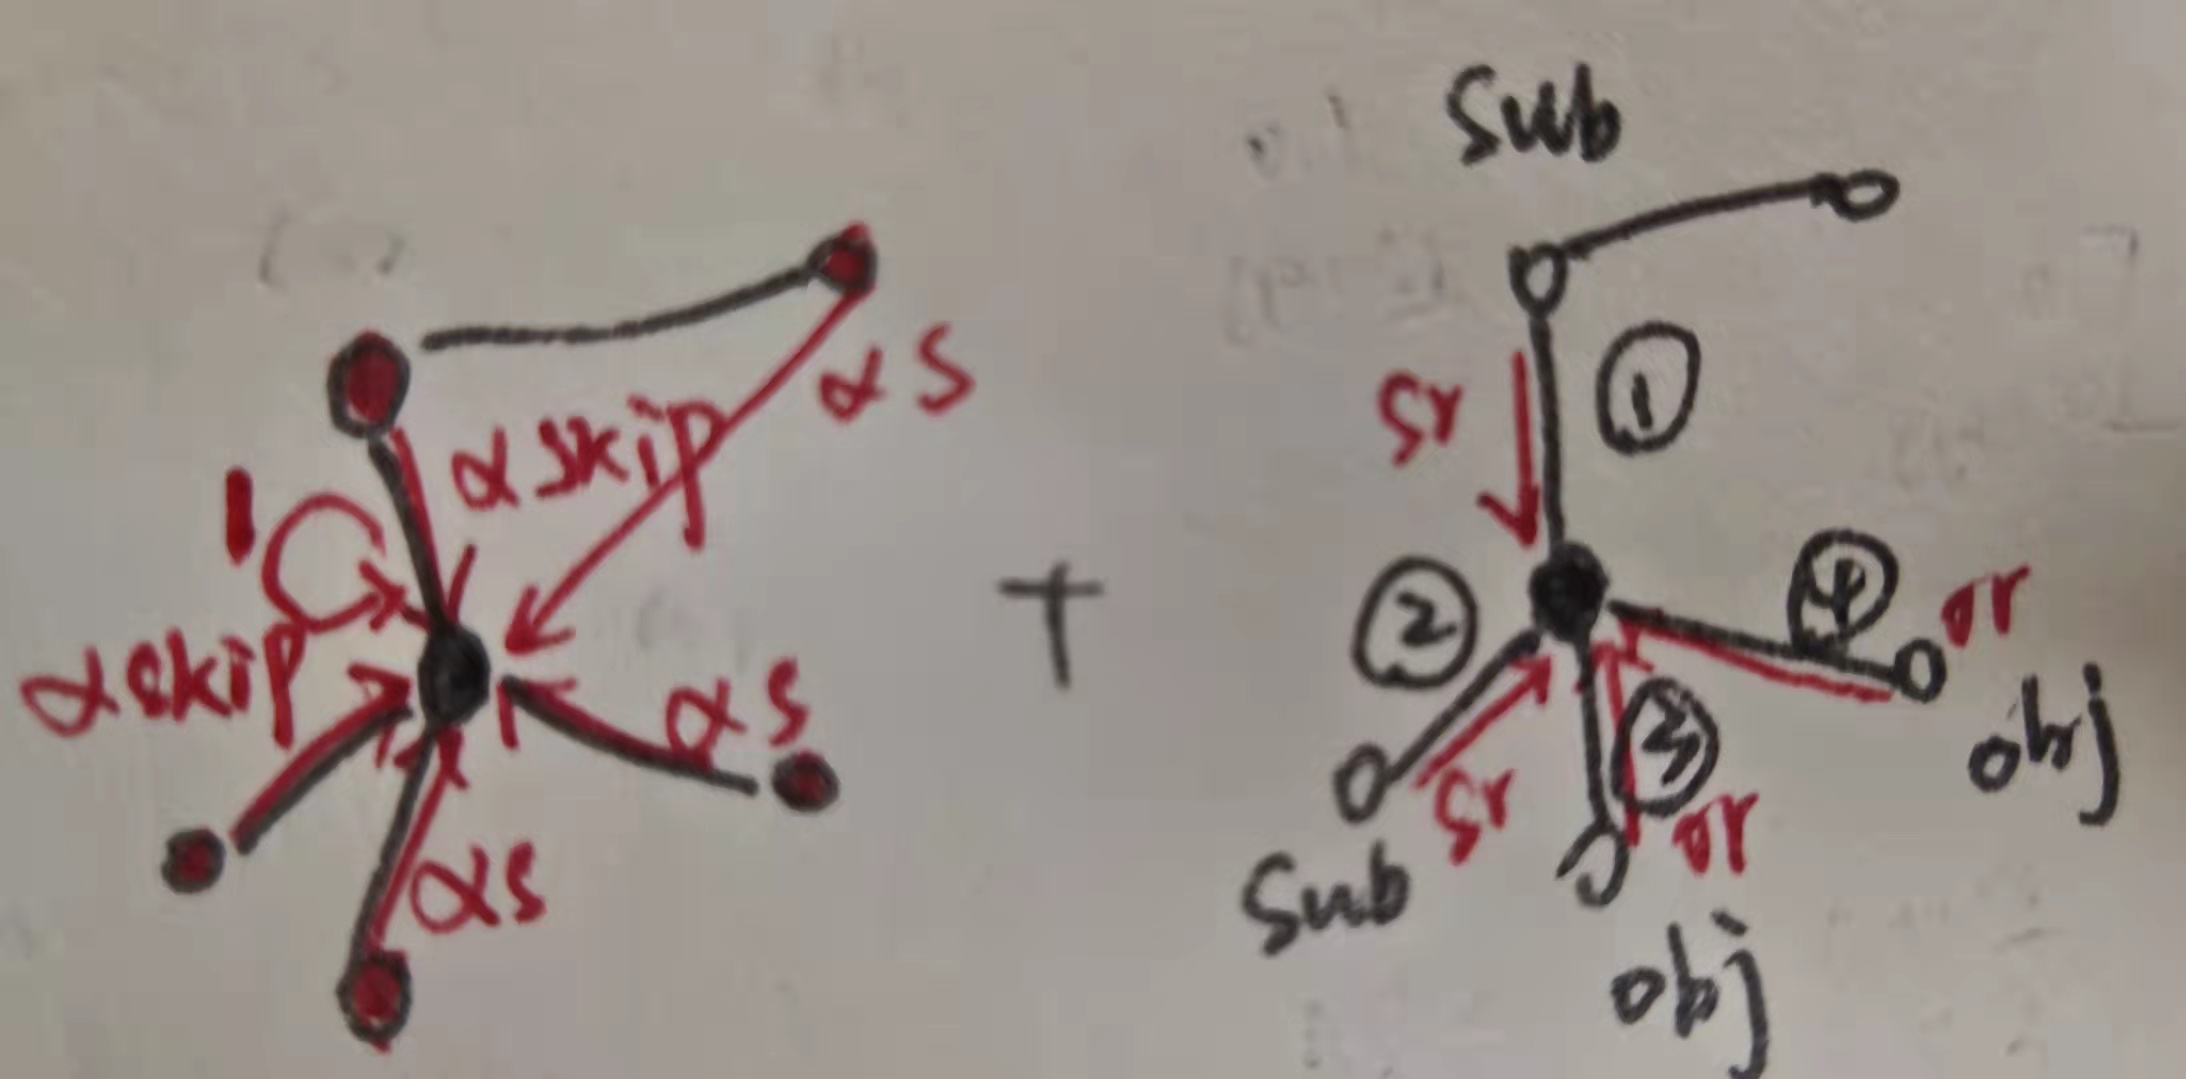
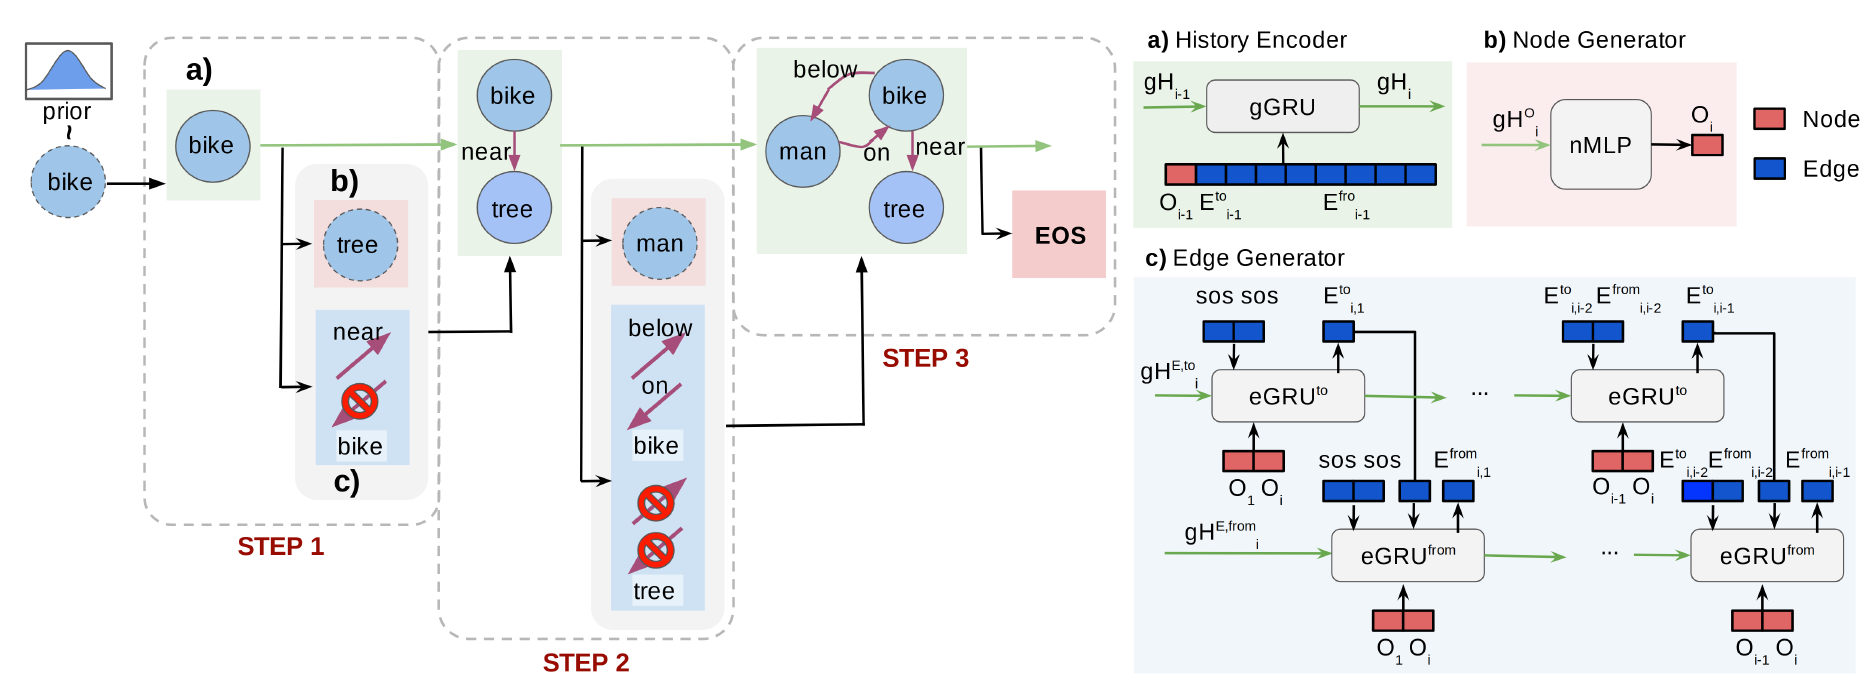
The formula above is still too abstract. I tried to draw a schematic diagram, and I didn't know if it was right. Maybe I could really understand the code in the future.
↓ Update relationship characteristic schematic diagram
↓ Update object feature schematic diagram (more complicated)
On the left is information from other Object, and the right side is the information from the neighbor.
(4) Category. After the above three steps, each node of Graph has the characteristics of integrating global information. Classification of object categories on the node, classification of the relationship category, and the loss function Crossesntropy.
Intelligent Recommendation
Scene Graph Generation by Iterative Message Passing (2017)
Scene Graph Generation by Iterative Message Passing Summary: Introduction: Related work Scene understanding and relationship representation Visual scene representation Graph reasoning: Scene graph gen...
Unconditional Scene Graph Generation Read notes
Task Unconditional scene graph generation. In the previous study of scene graph generation, scene graphs were generated based on conditions, while this work was to generate a complete scene graph base...
AAAI-Deep Generative Probabilistic Graph Neural Networks for Scene Graph Generation
Article address:Deep Generative Probabilistic Graph Neural Networks for Scene Graph Generation. Introduction Image visual understanding is a very important task in computer vision. Understanding a sce...

[Thesis Interpretation] FASTER R-CNN Real Time Target Detection
Foreword The highlight of the Faster R-CNN is to extract candidate boxes using RPN; RPN is full of region proposal network, and it is also understood as a zone generated network, or a region candidate...
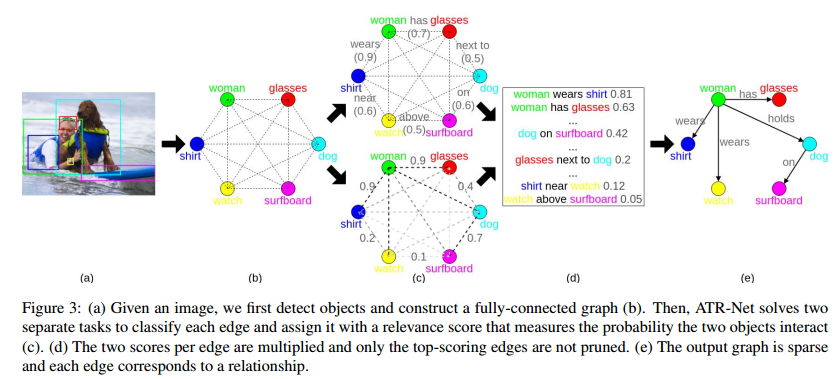
Scene Graph Generation Paper Reading Notes: Attention-Translation-Relation Network for Scalable Scene Graph Generation
Attention-Translation-Relation Network for Scalable Scene Graph Generation 2019 ICCV code: https://github.com/deeplab-ai/atr-net i am directory Attention-Translation-Relation Network for Scalable Scen...
More Recommendation

[Thesis Interpretation] Video Object Segmentation with Episodic Graph Memory Networks
Write a custom catalog title here Abstract 1Introduction 3Method 3.1 Fragment memory network 3.2 update 3.3 Graph memory model 3.3.1 Picture memory read 3.3.2 Segment map memory update 3.3.3 Readout o...
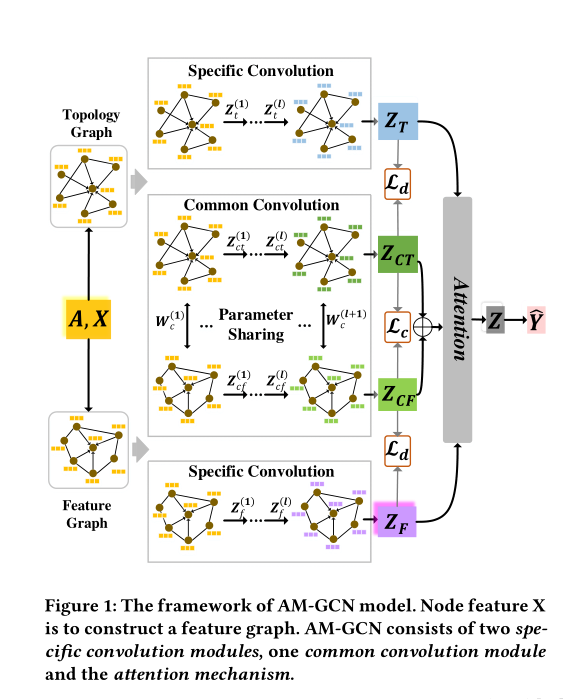
[Thesis] Interpretation AM-GCN: Adaptive Multi-Channel Graph Convolutional
Interpretation AM-GCN: Adaptive Multi-Channel Graph Convolutional Summary New issue asked now: Can GCNS optimize the characteristics of the integrated node in a rich complex map of information. Experi...

Scene Management - Scene Graph
Scene GraphThe name is the scene graph, or a kind of "graph" data structure used to organize the scene, usually in a logical relationship (such as the whole-Partly) Dividing the data, of cou...
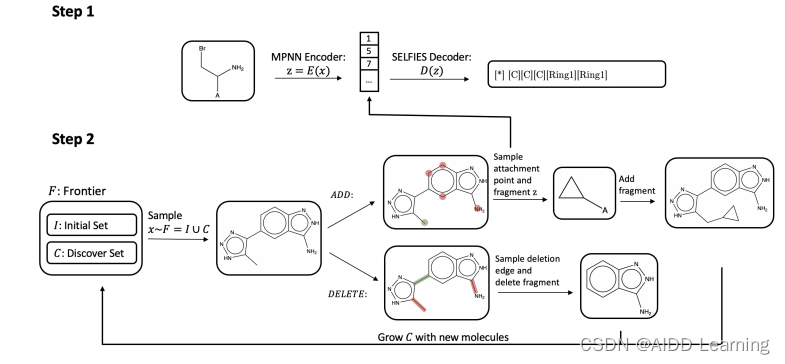
MIT PhD Thesis "Molecular Graph Representation Learning and Generation for Drug Discovery"
Table of contents summary: summary: Machine learning methods have been widely popular in the field of drug discovery, enabling more powerful and more effective models. Prior to the depth modeli...
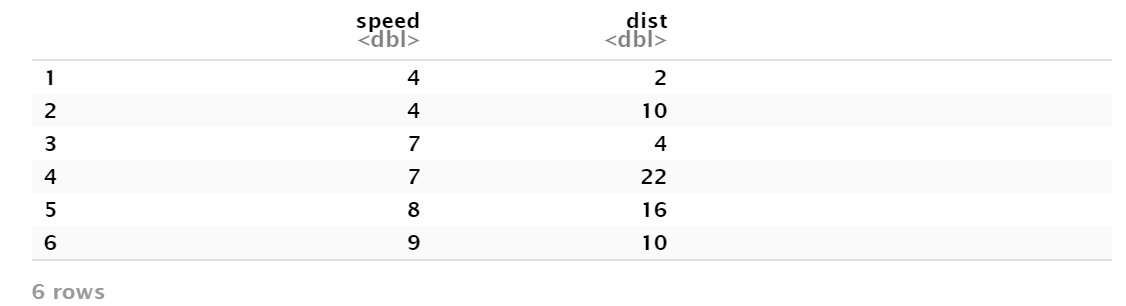
R graph
R basic drawing - scatter plot & line diagram title: “R Graph” author: “intro” date: “2022/1/18” output: pdf_document: default html_document: default Insert a c...