R language modification axis
tags: R
When using R language for drawing, modify the coordinate axis mainly by adjusting the parameters in the plot function, axis function and title function.
plot function
plot(x,y, ...)
axis(side, at = NULL, labels = TRUE, tick = TRUE, line = NA,
     pos = NA, outer = FALSE, font = NA, lty = "solid",
     lwd = 1, lwd.ticks = lwd, col = NULL,col.ticks = NULL,
     hadj = NA, padj = NA, ...)
title(main= NULL, sub = NULL, xlab = NULL, ylab = NULL,
      line = NA, outer = FALSE, ...)
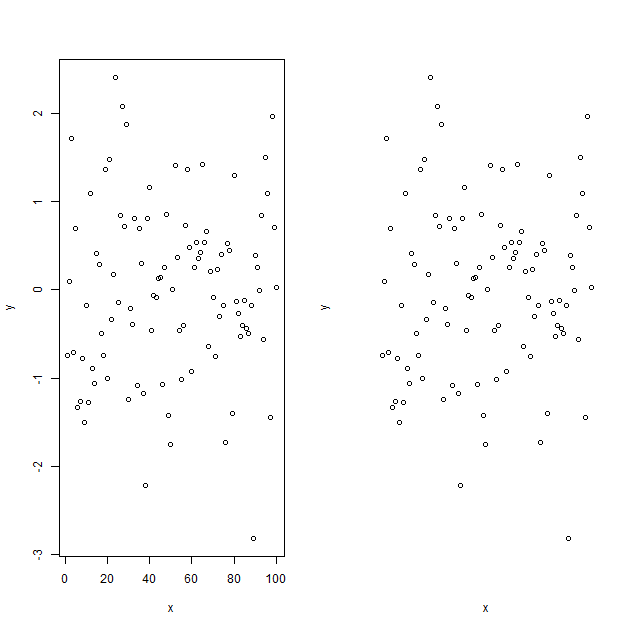
Among the personalized coordinate axes, the parameters to be adjusted usually include ann, bty, xaxt, yaxt, xaxs and yaxs:
| Serial number | parameter | operating |
|---|---|---|
| 1 | ann | When FALSE is taken, the title (including main, subtitle and axis title) will not be drawn. |
| 2 | bty | Set the border form. The default value is "o", which means that all four borders are drawn. The remaining optional values include "l" (bottom left), "7" (top right), "c" (top left), "u" (bottom left), "]" (top right), and "n" (none, That is, no border is drawn). In many personalized drawings, bty is set to "n", and later border lines are added by other functions (such as axis). |
| 3 | xaxs/yaxs | Set the range of the x-axis and y-axis. The default value is "r", which means that the coordinate axis is larger than the given drawing range and larger than the range given by the parameters xlim and ylim. When the value is "i", it means that the coordinate axis range is completely the same as the given drawing range. Other values include "s", "e", "d", etc. |
| 4 | xaxt/yaxt | When "n" is selected, the coordinate axis, scale line and scale value will not be drawn. |
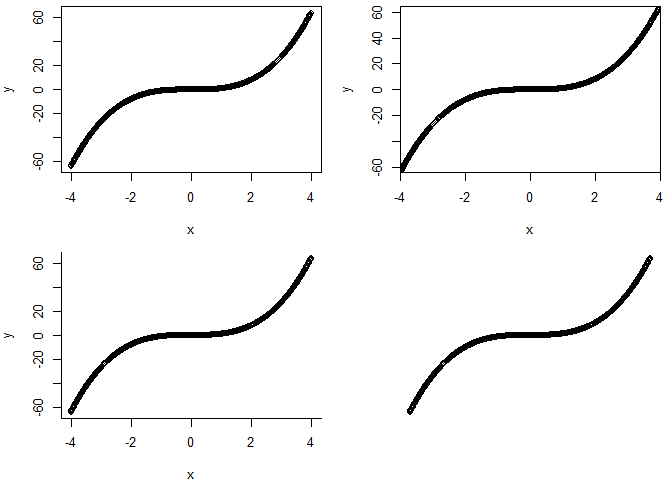
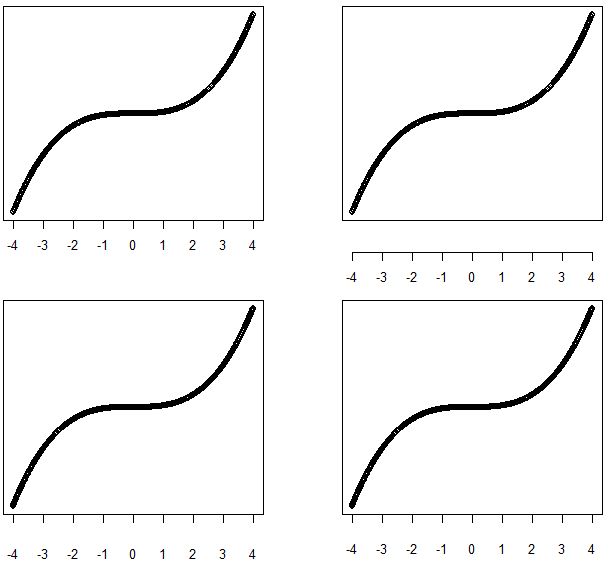
To Drawing as an example:
x <- seq(-4, 4, 0.01)
y <- x ^ 3
par(mfrow = c(2, 2), mar = c(4, 4, 1, 1))
plot(x, y)   # Not processed
plot(x, y,  xaxs = "i", yaxs ="i")   # Drawing border is not blank
plot(x, y, bty = 'l')   # Keep only the left and bottom borders
plot(x, y, ann = F, bty = "n", xaxt = "n", yaxt = "n")   # Remove the frame and coordinate axis
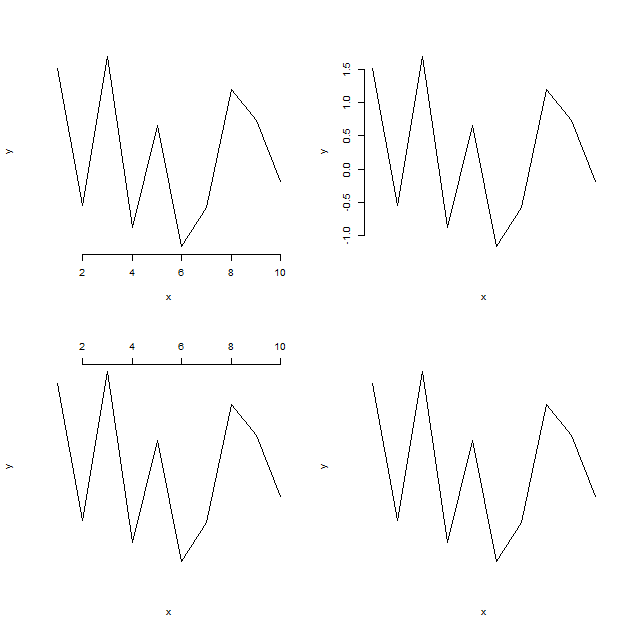
axis function
| Serial number | parameter | operating |
|---|---|---|
| 1 | side | Represents the coordinate axis to be operated, and the values 1, 2, 3, and 4 represent down, left, up, and right, respectively. |
| 2 | at | Indicates the position of the tick mark and the scale value. |
| 3 | labels | Indicates the scale value. |
| 4 | las | Indicates the text direction of the coordinate scale value. A value of 0 indicates that the text direction is parallel to the coordinate axis, 1 indicates that it is always horizontal, 2 indicates that it is perpendicular to the coordinate axis, and 3 indicates that it is ultimately vertical. |
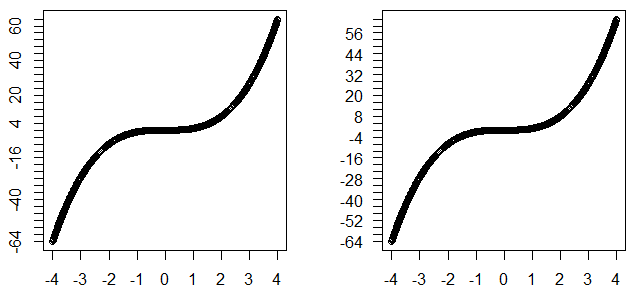
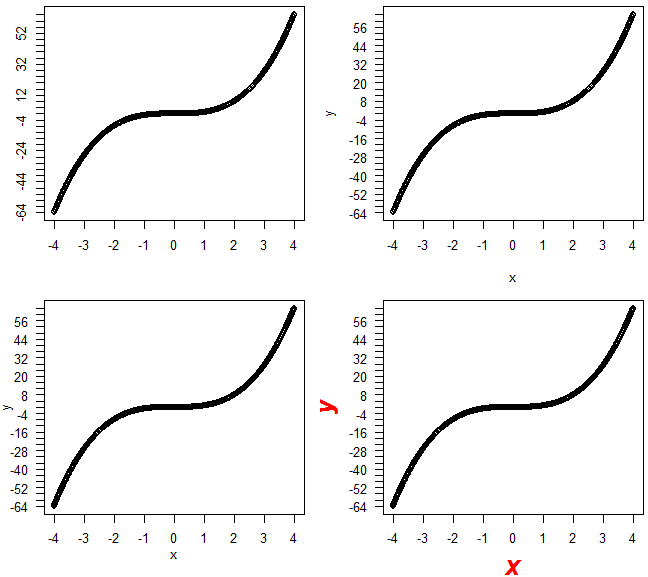
x <- seq(-4, 4, 0.01)
y <- x ^ 3
par(mfrow = c(1, 2), mar = c(4, 4, 1, 1))
#The text direction is not set
plot(x, y, ann = F, xaxt = "n", yaxt = "n")
axis(1, -4 : 4, -4 : 4)
axis(2, seq(-64, 64, 4), seq(-64, 64, 4))
#Text direction horizontal
plot(x, y, ann = F, xaxt = "n", yaxt = "n")
axis(1, -4 : 4, -4 : 4, las = 1)
axis(2, seq(-64, 64, 4), seq(-64, 64, 4), las = 1)
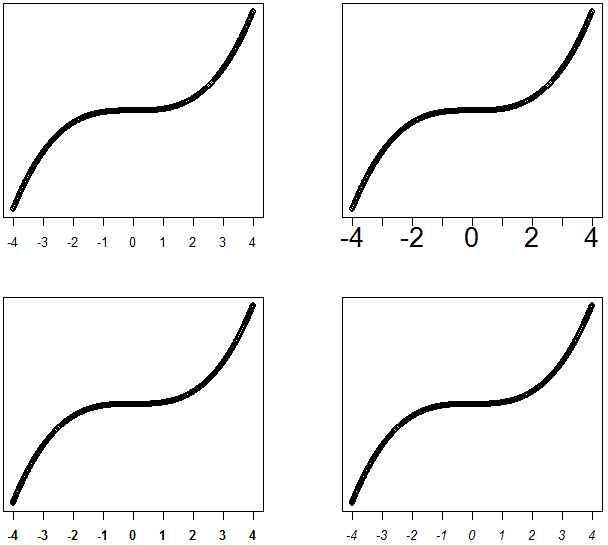
Font size
| Serial number | parameter | operating |
|---|---|---|
| 1 | cex.axis | The font size indicating the scale value of the coordinate axis. |
| 2 | font.axis | A font indicating the scale value of the coordinate axis, font = 1 for normal, 2 for bold, 3 for italics, and 4 for black italics. |
x <- seq(-4, 4, 0.01)
y <- x ^ 3
par(mfrow = c(2, 2), mar = c(4, 4, 1, 1))
#The font size is not set
plot(x, y, ann = F, xaxt = "n", yaxt = "n")
axis(1, -4 : 4, -4 : 4)
#cex.axis = 2
plot(x, y, ann = F, xaxt = "n", yaxt = "n")
axis(1,-4:4, -4:4, cex.axis = 2)
#font.axis = 2
plot(x, y, ann = F, xaxt = "n", yaxt = "n")
axis(1, -4 : 4, -4 : 4, font.axis = 2)
#font.axis = 3
plot(x, y, ann = F, xaxt = "n", yaxt = "n")
axis(1,-4 : 4, -4 : 4, font.axis = 3)
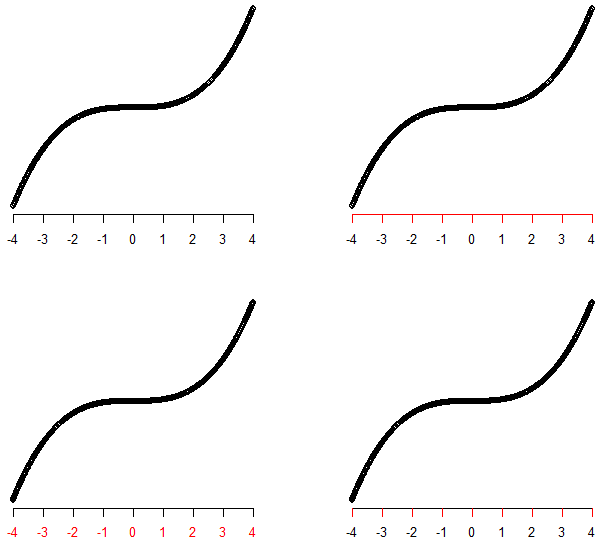
colour
| Serial number | parameter | operating |
|---|---|---|
| 1 | col | Represents the color of the graph, used in the axis function to represent the color of the coordinate axis and coordinate scale line. |
| 2 | col.axis | The color indicating the scale value of the coordinate axis. |
| 3 | col.ticks | Represents the color of the axis tick marks. |
x <- seq(-4, 4, 0.01)
y <- x ^ 3
par(mfrow = c(2, 2), mar = c(4, 4, 1, 1))
#Color not set
plot(x, y, ann = F, bty = "n", xaxt = "n", yaxt = "n")
axis(1,-4 : 4, -4 : 4)
#col = 2
plot(x, y, ann = F, bty = "n", xaxt = "n", yaxt = "n")
axis(1,-4 : 4, -4 : 4, col = 2)
#col.axis = 2
plot(x, y, ann = F, bty = "n", xaxt = "n", yaxt = "n")
axis(1,-4 : 4, -4 : 4, col.axis = 2)
#col.ticks = 2
plot(x, y, ann = F, bty = "n", xaxt = "n", yaxt = "n")
axis(1,-4 : 4, -4 : 4, col.ticks = 2)
position
| Serial number | parameter | operating |
|---|---|---|
| 1 | line | Represents the distance between the coordinate axis position and the image frame. When a negative number is taken, it will be drawn within the image frame. |
| 2 | mgp | The default value is c(3, 1, 0), and the three numbers represent the axis title, scale value, and the distance between the axis and the drawing border. |
| 3 | tcl | The default value is -0.5, the value indicates the length of the scale, the negative value indicates that the scale is facing outward, and the positive value is facing in. |
| 4 | pos | Represents the location of the axis. |
| 5 | line.outer | When the value is TRUE, the coordinate axis will be drawn at the edge of the canvas. |
| 6 | hadj | Refers to the distance to adjust the scale value along the direction of the parallel coordinate axis. |
| 7 | padj | Refers to the distance to adjust the scale value along the direction of the vertical coordinate axis. |
x <- seq(-4, 4, 0.01)
y <- x ^ 3
par(mfrow = c(2, 2), mar = c(4, 4, 1, 1))
# The position of the scale value is not set
plot(x, y, ann = F, xaxt = "n", yaxt = "n")
axis(1, -4 : 4, -4 : 4)
# Use line to adjust the scale value position
plot(x, y, ann = F, xaxt = "n", yaxt = "n")
axis(1, -4 : 4, -4 : 4, line = 2)
# Use mgp to adjust the scale value position
plot(x, y, ann = F, xaxt = "n", yaxt = "n")
axis(1, -4 : 4, -4 : 4, mgp = c(3, 2, 0))
# Use padj to adjust the scale value position
plot(x, y, ann = F, xaxt = "n", yaxt = "n")
axis(1, -4 : 4, -4:4, padj = 1)
title
Usage of title function
| Serial number | parameter | operating |
|---|---|---|
| 1 | main | Main title |
| 2 | sub | subtitle |
| 3 | xlab | x-axis title |
| 4 | ylab | y-axis title |
| 5 | cex.lab | The font size of the axis title |
| 6 | font.lab | Font for axis title |
| 7 | col.lab | The color of the axis title |
| 8 | Other parameters | Same usage as in axis |
x <- seq(-4, 4, 0.01)
y <- x ^ 3
par(mfrow = c(2, 2), mar = c(4, 4, 1, 1))
#Untitled
plot(x, y, ann = F, xaxt = "n", yaxt = "n")
axis(1, -4 : 4, -4 : 4)
axis(2, seq(-64, 64, 4), seq(-64, 64, 4))
#Use title to set the title
plot(x, y, ann = F, xaxt = "n", yaxt = "n")
axis(1, -4 : 4, -4 : 4, las = 1)
axis(2, seq(-64, 64, 4), seq(-64, 64, 4), las = 1)
title(xlab= 'x', ylab = 'y')
#Use line to adjust the position
plot(x, y, ann = F, xaxt = "n", yaxt = "n")
axis(1, -4 : 4, -4 : 4, las = 1)
axis(2, seq(-64, 64, 4), seq(-64, 64, 4), las = 1)
title(xlab= 'x', ylab = 'y', line = 2)
#Adjust the color font size
plot(x, y, ann = F, xaxt = "n", yaxt = "n")
axis(1, -4 : 4, -4 : 4, las = 1)
axis(2, seq(-64, 64, 4), seq(-64, 64, 4), las = 1)
title(xlab= 'x', ylab = 'y', col.lab = 2, font.lab = 4, cex.lab = 2)
Welcome to criticize and correct.
Intelligent Recommendation
R language ggplot2 removes graphics and coordinate axis gaps
Ggplot2 has a gap between the default theme graphic and the axis, which may seem uncomfortable. In addition, when the column chart has only two columns, you want to enlarge the column gap, you can als...
Five, R --ggplot2 language of visual scale, and the axis legend Explanation
This switched: http: //www.cnblogs.com/lizhilei-123/p/6808370.html Scaling control data is mapped to the attribute pattern, when necessary, ggplot2 automatically adds a default scale. We really can dr...
R language bar chart, solve the problem of x-axis text sorting
Graphical display of data results, R code, "R Data Science" is a good thing The data format is as follows: term category pval neutrophil chemotaxis biological_process 1.68E-09 innate immune ...
R language 10-drawing outlier processing (limit axis)
There are many reasons for abnormal values. Some outliers are accurate data in extreme cases, and some are bad data. The appearance of abnormal values often causes long tail data In order to avoid l...
Example analysis of drawing in R language, coordinate axis, legend and other settings
Analyze the drawing of R language through a specific case, mainly including the addition of auxiliary lines, the basic parameter setting of the plot() function, and the setting of the legend axis. cas...
More Recommendation

R language ggplot2x axis order to set custom colors
First declare the data set used The first picture is as follows This figure mainly lies in the order setting of the x-axis. If no processing is done, the >3 will be before the 2. The solution is b[...
R language double coordinate axis combined graphics visualization realization
"In the process of data visualization, two different types of chart combinations are often encountered, which is the so-called dual-axis combination chart. I encountered this problem in recent st...
Study notes (101): Basics of R language entry-axes axis control
Learn now: axes control Axes=FALSE means that the graph has no axes; the default value is TRUE, which means there are axes Corresponding results:...
Study notes (113): basic R language introduction-axis function
Learn now: axis function side is side side=1, the content is placed at the bottom of the figure side=2, the content is placed on the left side of the figure side=3, the content is placed at the top of...
Original R language column chart sort and tag tilt on the X-axis
The R-language is roughly two ways, one is the Barplot function in the base library, and the other is Geom_bar in the ggplot2 package. This is the character variable statistics to each of its frequenc...