Lesson 2-4: Data Distribution Statistics and Heat Map
tags: Get started with Python data visualization data visualization data analysis
This lesson will continue to introduce statistical graphs in Seaborn. It must be remembered that Seaborn is an advanced encapsulation of Matplotlib. It optimizes a lot of the ancient drawing process, so you will see a function to solve the problem.
2.4.1 Data Distribution Statistics
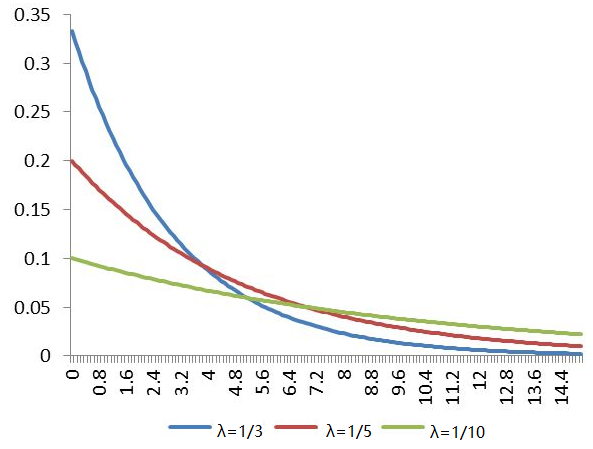
In statistics, studying the distribution of data is also an important task, such as whether certain data is normally distributed—some machine learning models care about the distribution of data.
In Matplotlib, you can visualize the distribution of data by drawing a histogram. In Seaborn, a function for drawing histograms is also provided.
%matplotlib inline
import seaborn as sns
import numpy as np
sns.set()
np.random.seed(0)
x = np.random.randn(100)
ax = sns.distplot(x)
Output result:

The sns.distplot function implements the histogram and draws the curve by the way-the curve actually represents KDE.
seaborn.distplot(a, bins=None, hist=True, kde=True, rug=False, fit=None, hist_kws=None, kde_kws=None, rug_kws=None, fit_kws=None, color=None, vertical=False, norm_hist=False, axlabel=None, label=None, ax=None)
Except sns.distpl
Intelligent Recommendation
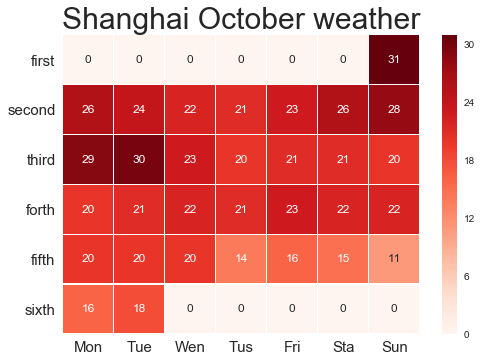
Crawling weather data + heat map
It is the first time to use old knowledge to crawl weather website data. Crawling weather data; Make a weather heat map again....

Data visualization notes ~ heat map
#Data Visualization Notes~Heat Map ~Use the ggHeatmap function of the ggiraphExtra package 1. The results are as follows: 2. Data frame type, facet drawing The results are as follows: 3. Data with row...
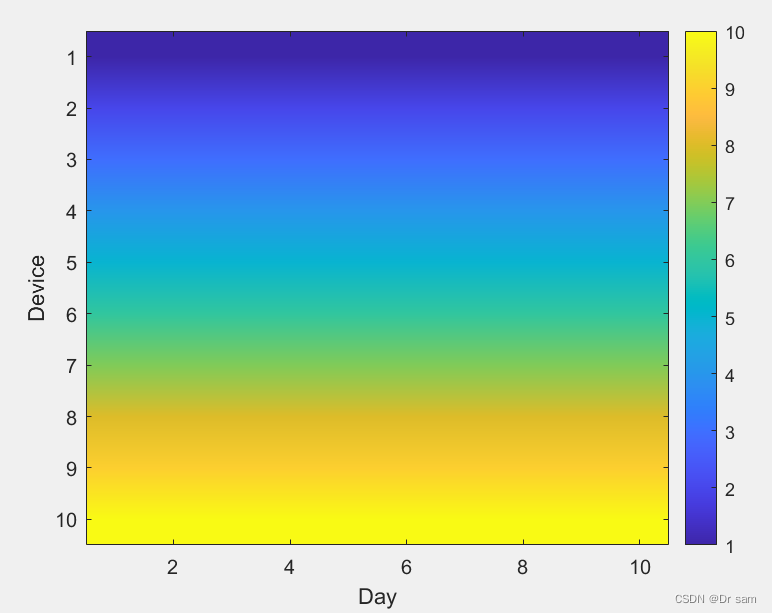
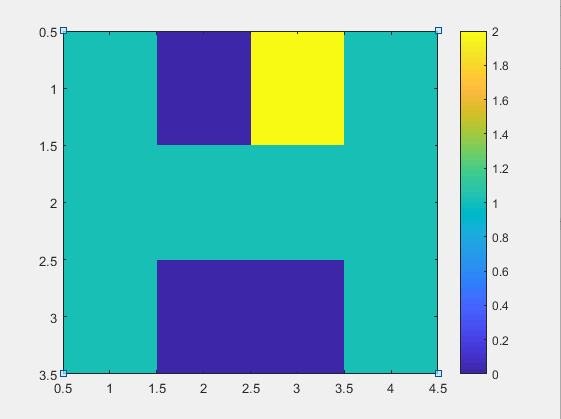
Matlab data visualization-heat map
The annotations in the code are very detailed, so I will not explain it separately 1. Draw a basic heating map 1.1 Detailed code 1.2 Effect chart 2. Multi -child diagram shares a colorbar/band 2.1 Det...

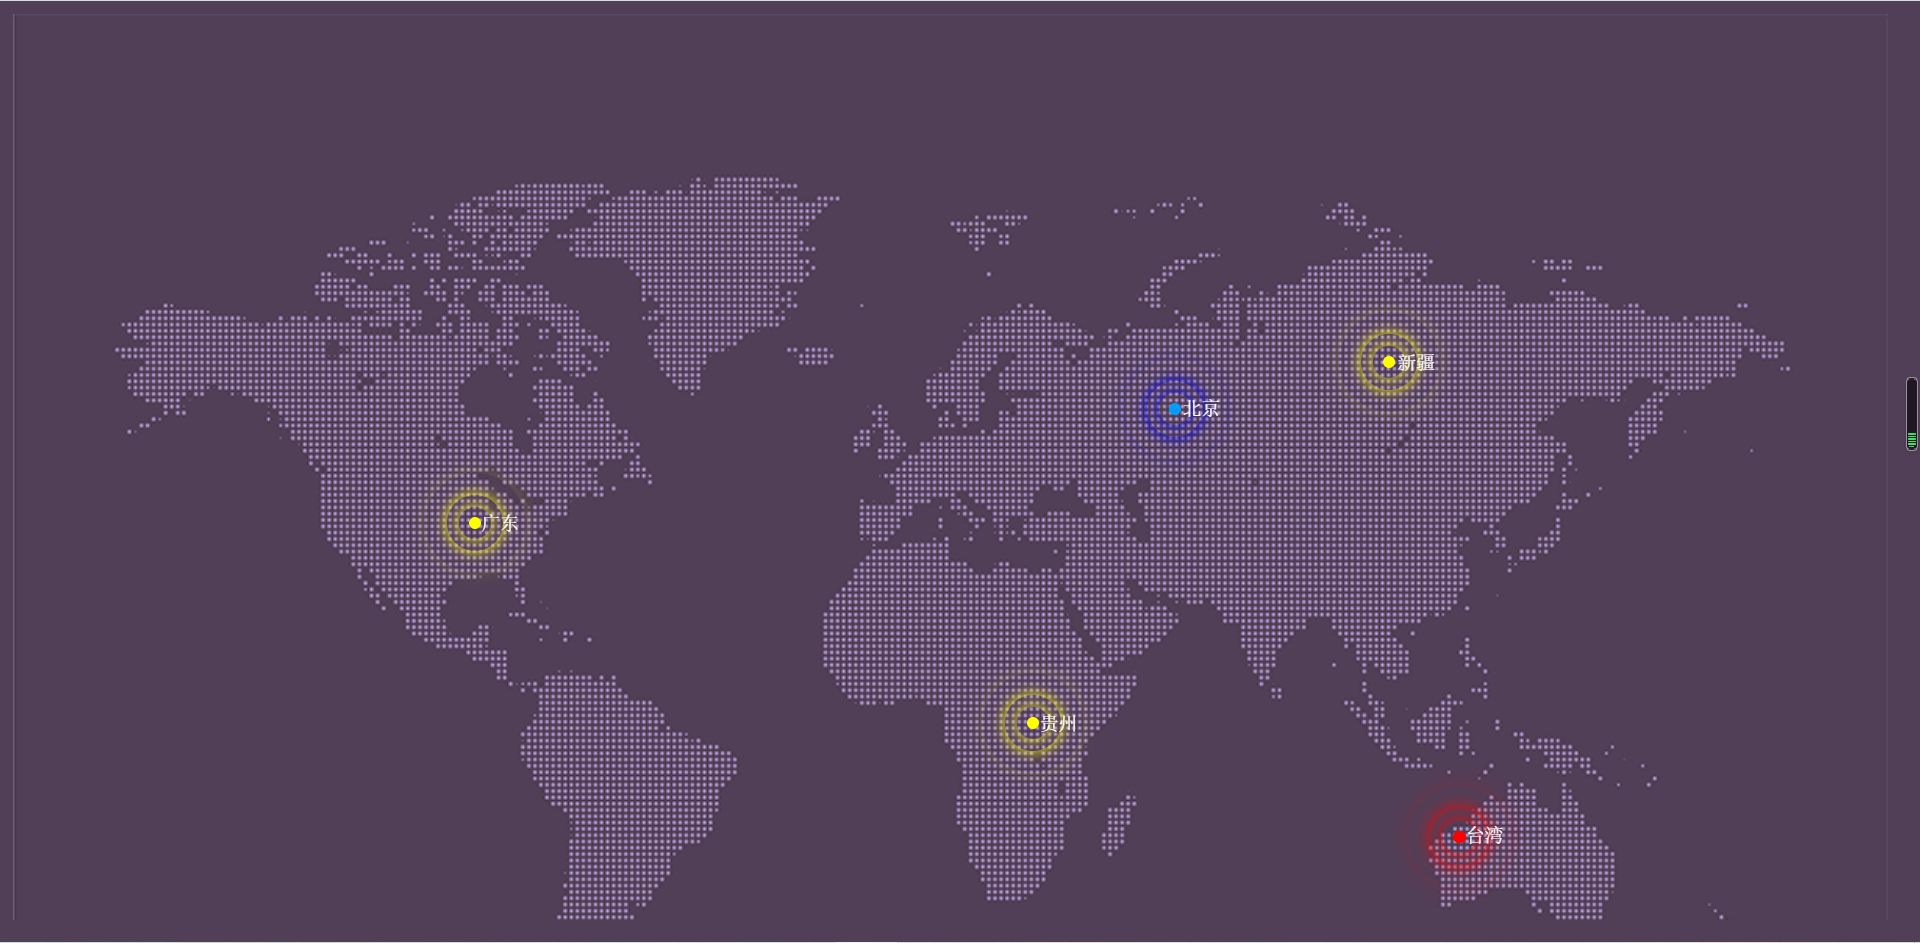
Vue+ECharts4.x map drill/scatter point distribution and heat map
Because echarts is used for work reasons, it is necessary to realize three functions: national to provincial map drilling and scatter distribution and heat map display There is very little information...
More Recommendation
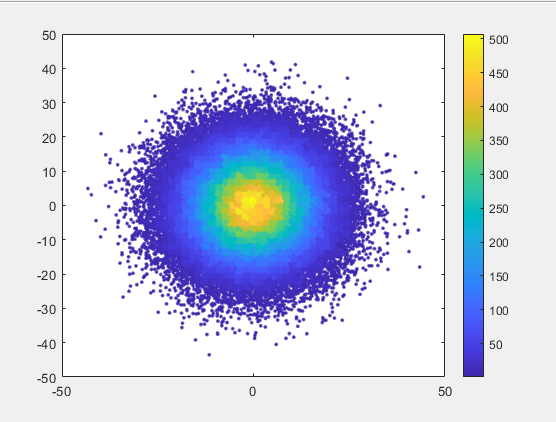
A simple method of drawing 2D heat map/distribution map with matlab
Most of the methods for drawing heat maps found on the Internet are far from what I expected. Finally, I found a code that can be used to draw heat maps/distribution maps after improvements. This code...
Gaode map heat map project (2)
The sixth step, create a heat map 1, create a new web project, use the ssm framework Add the following dependencies 2, configure web.xml 3, create a resource directory Create a resource directory reso...
Statistics 2: Random variables and their distribution
In some random tests, the results can be represented by a value. At this time, the element of the sample space S is a number; however, some tests, when the elements of the sample space S are not numbe...
Binary histogram frequency statistics (scattered density heat map) and its heat map method
Perform density statistics on the scatter plot and draw its corresponding heat map. Two functions are mainly used, one is histcounts2 and imagesc, which will be explained in sequence below. For the sp...

Lesson 2-3: Relation Statistics and Regression Statistics
The difference between the relationship graph and regression graph introduced in this lesson and the classification feature statistical graph in the previous lesson is that the purpose of these two ty...