Pyvista---(4) Commonly used functions and applications in pyvistaOne
tags: Image visualization Visualization
Commonly used functions and applications in pyvista-1
- 1. Multiple plots, similar to matplotlib
- 2. Specify colors and smooth shadows
- 3. Create a point cloud
- 3.1 Assign value to point cloud
- 3.2 Draw a vector and store the value of the vector in the point cloud
- 4. Drawing multi-faceted pictures, not closed
- 5. Draw lines
- 6. Drawing shows, curved surface, three-dimensional mask
- 7 Create an empty grid structure, and then set the coordinates
1. Multiple plots, similar to matplotlib
p = pv.Plotter(shape=(3, 3))
p.subplot(0, 0)
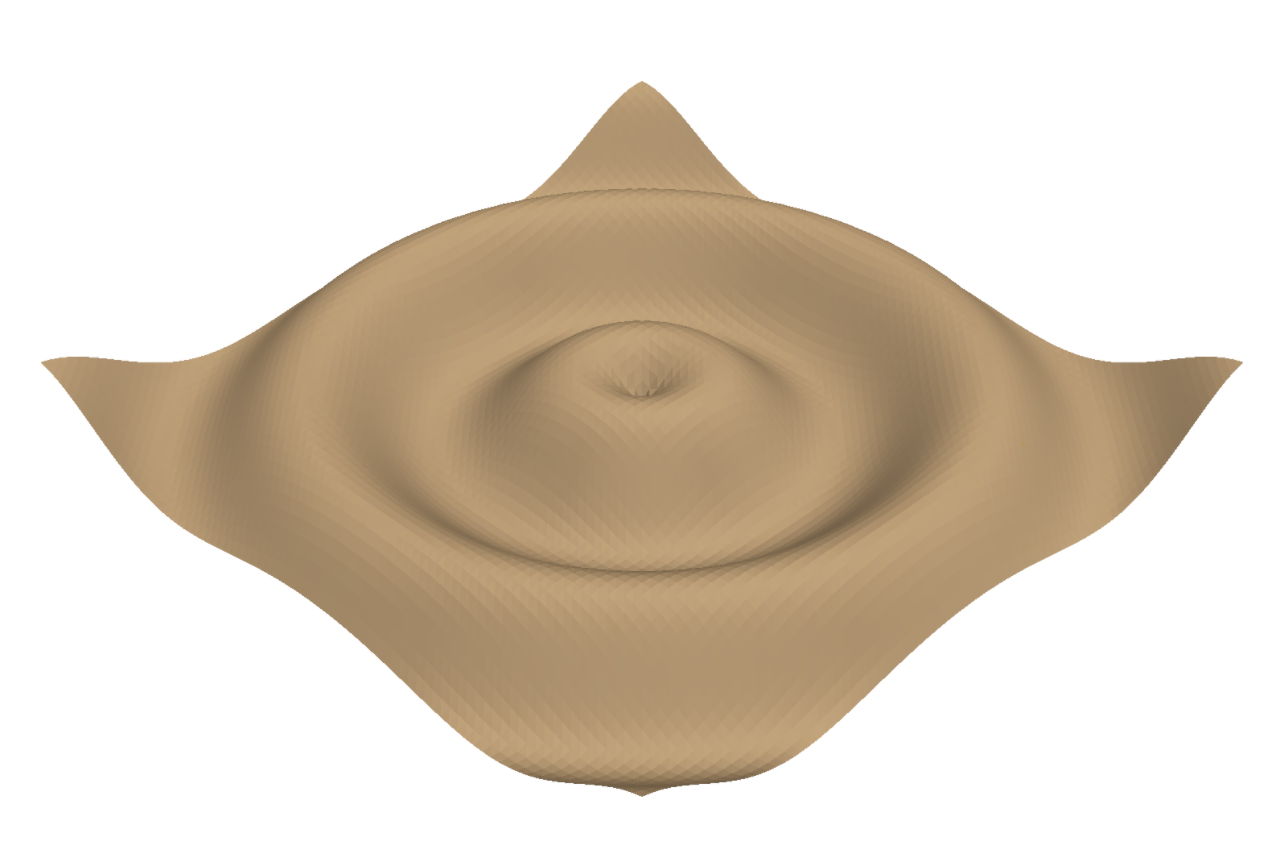
2. Specify colors and smooth shadows
supertoroid.plot(color="tan", smooth_shading=True)
3. Create a point cloud
import pyvista as pv
import numpy as np
## Generate a set of point cloud coordinates, and then construct the point cloud mesh
points = np.random.rand(30000, 3)
point_cloud = pv.PolyData(points)
print np.allclose(points, point_cloud.points)#Check whether it is consistent
# Draw a point cloud
point_cloud.plot(eye_dome_lighting=True)

3.1 Assign value to point cloud
## Assign a value to the point cloud, here the value of the z-axis coordinate is assigned to the point cloud
data = points[:,-1]
point_cloud["value"] = data
point_cloud.plot(render_points_as_spheres=True)

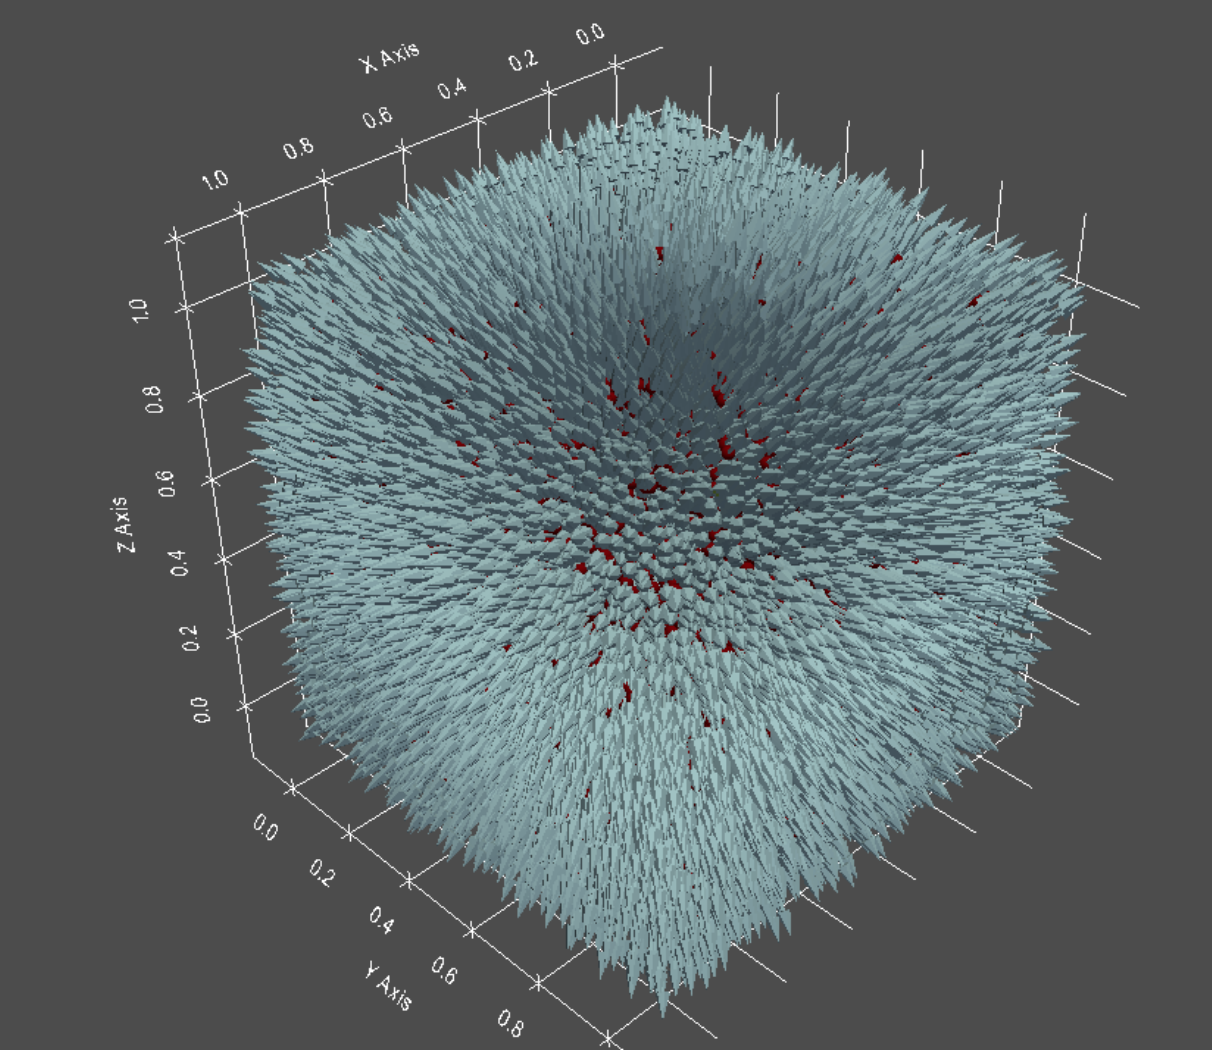
3.2 Draw a vector and store the value of the vector in the point cloud
Because the mesh assigns many values to the points, in the form of a dictionary, only the number of pairs is required, and the order of the points in the mesh should be the same as the storage order of the values.
def compute_vectors(mesh):
    origin = mesh.center
    vectors = mesh.points - origin
    vectors = vectors / np.linalg.norm(vectors, axis=1)[:, None]
    return vectors

vectors = compute_vectors(point_cloud)
point_cloud['vectors'] = vectors
 arrows = point_cloud.glyph(orient='vectors', scale=False, factor=0.15,) #Build arrows through this function
# Display the arrows
plotter = pv.Plotter()
plotter.add_mesh(point_cloud, color='maroon', point_size=10.,
                 render_points_as_spheres=True)
plotter.add_mesh(arrows, color='lightblue')
# plotter.add_point_labels([point_cloud.center,], ['Center',],
#                          point_color='yellow', point_size=20)
plotter.show_grid()
plotter.show()
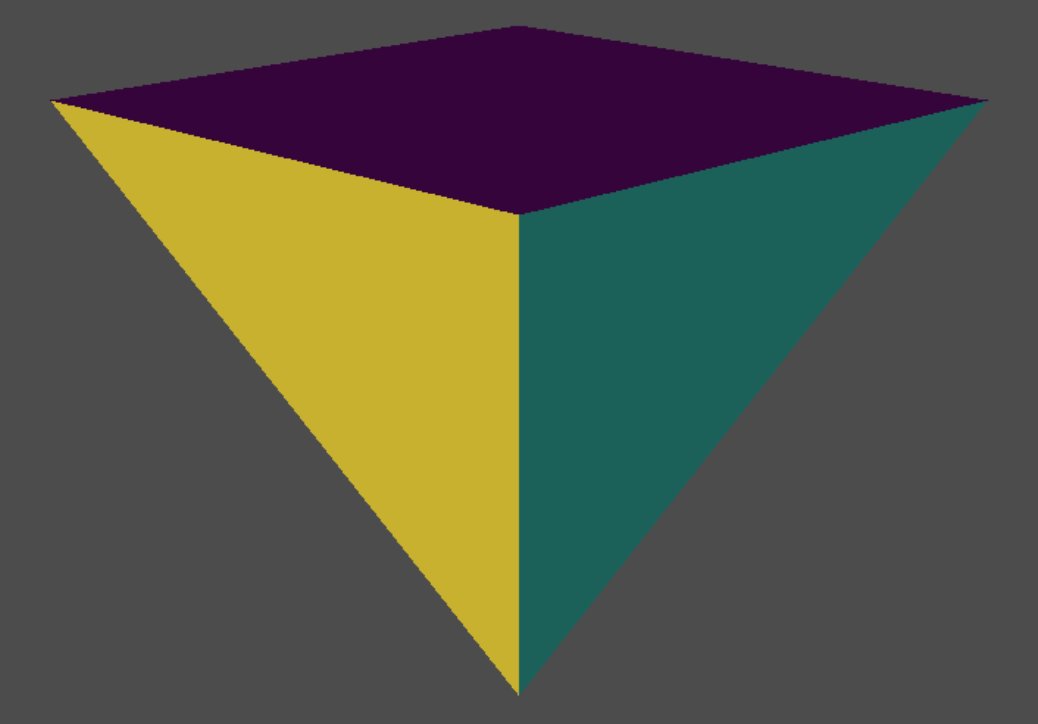
4. Drawing multi-faceted pictures, not closed
import pyvista as pv
# mesh points
vertices = np.array([[0, 0, 0],
                     [1, 0, 0],
                     [1, 1, 0],
                     [0, 1, 0],
                     [0.5, 0.5, -1]])

# mesh faces, I don’t know what this means, how do I define it?
faces = np.hstack([[4, 0, 1, 2, 3],  # square
                   [3, 0, 1, 4],     # triangle
                   [3, 1, 2, 4]])    # triangle

surf = pv.PolyData(vertices, faces)
surf.cell_arrays['scalars'] = np.arange(3)
# plot each face with a different color
# surf.plot(scalars=np.arange(3), cpos=[-1, 1, 0.5])

 p = pv.Plotter() ## Build an ordinary drawing board
 # p = pv.BackgroundPlotter() ## Build an interactive drawing board
p.camera_position = [-1, 1, 0.5]
p.add_mesh(surf)
p.show()
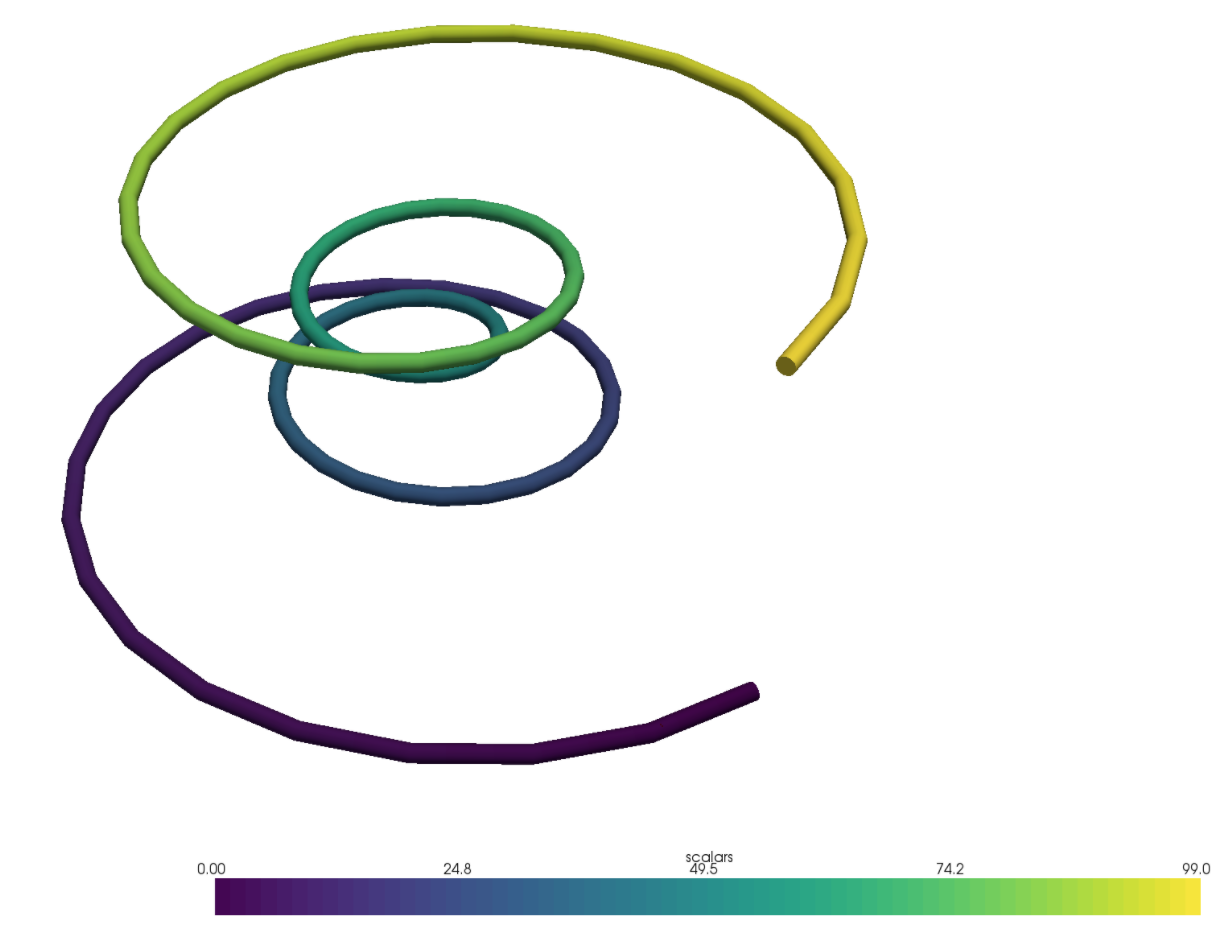
5. Draw lines
https://docs.pyvista.org/examples/00-load/create-spline.html
def make_points():
    """Helper to make XYZ points"""
    theta = np.linspace(-4 * np.pi, 4 * np.pi, 100)
    z = np.linspace(-2, 2, 100)
    r = z**2 + 1
    x = r * np.sin(theta)
    y = r * np.cos(theta)
    return np.column_stack((x, y, z))

points = make_points()

def polyline_from_points(points):
    poly = pv.PolyData()
    poly.points = points
    the_cell = np.arange(0, len(points), dtype=np.int)
    the_cell = np.insert(the_cell, 0, len(points))
    poly.lines = the_cell
    return poly

polyline = polyline_from_points(points)
polyline["scalars"] = np.arange(polyline.n_points)
tube = polyline.tube(radius=0.1)
tube.plot(smooth_shading=True)
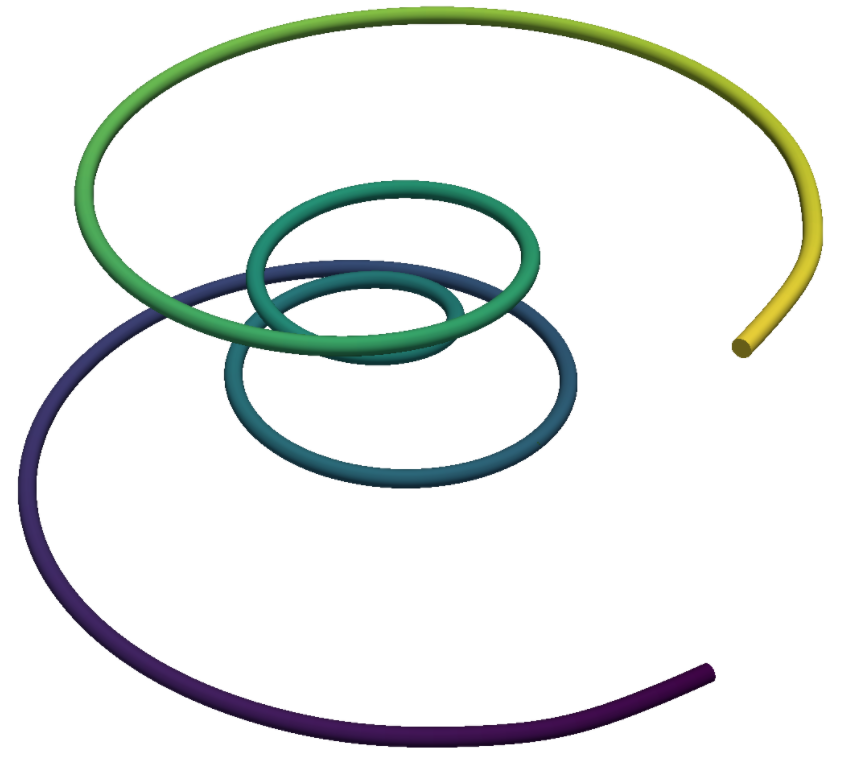
5.1 Make the lines smoother
By interpolation
# Create spline with 1000 interpolation points
spline = pv.Spline(points, 1000)

# add scalars to spline and plot it
spline["scalars"] = np.arange(spline.n_points)
tube = spline.tube(radius=0.1)
tube.plot(smooth_shading=True)
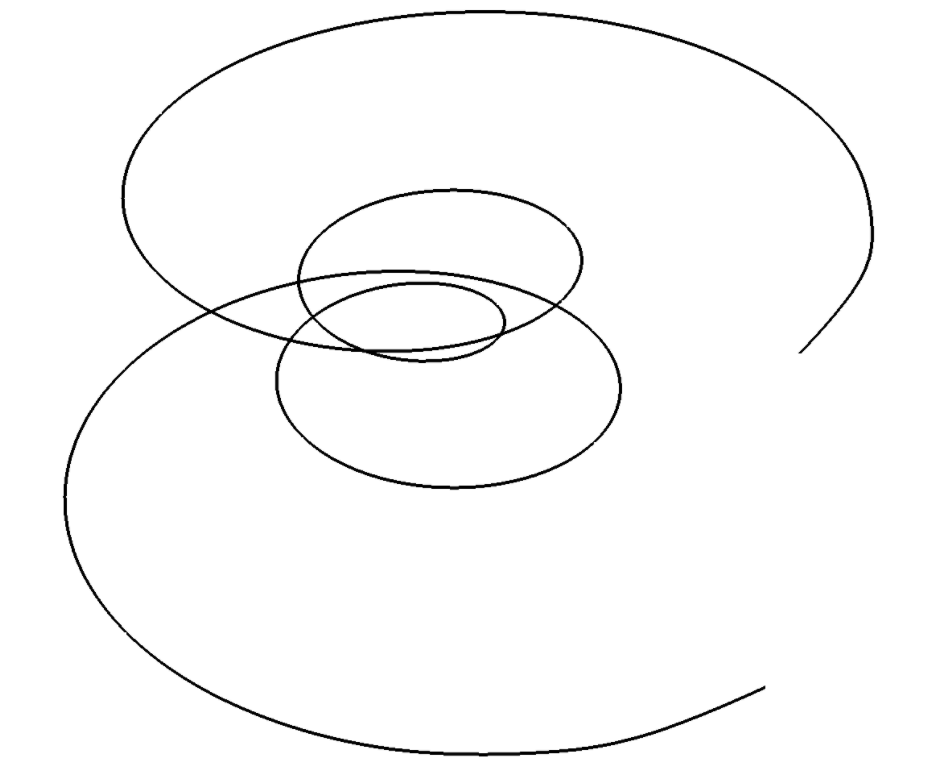
5.2 Draw center line/thin line
Splines can also be drawn as ordinary lines
# generate same spline with 400 interpolation points
spline = pv.Spline(points, 400)

# plot without scalars
spline.plot(line_width=4, color="k")
6. Drawing shows, curved surface, three-dimensional mask
https://docs.pyvista.org/examples/00-load/create-structured-surface.html
First build a numpy meshgrid, and then draw with pyvista.
import pyvista as pv
from pyvista import examples
import numpy as np

x = np.arange(-10, 10, 0.25)
y = np.arange(-10, 10, 0.25)
x, y = np.meshgrid(x, y)
r = np.sqrt(x ** 2 + y ** 2)
z = np.sin(r)

grid = pv.StructuredGrid(x, y, z)
grid.plot()
Visit the value of the point:
grid.points
6.1 Plotting the mean curvature
# Plot mean curvature as well
grid.plot_curvature(clim=[-1, 1])
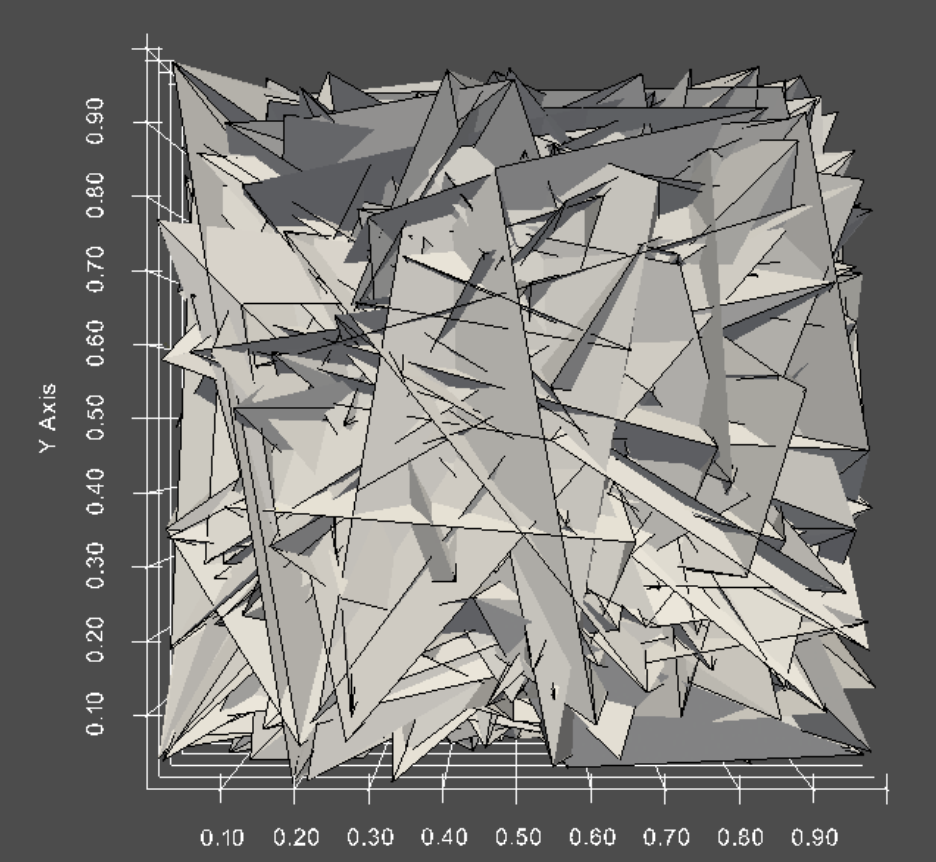
7 Create an empty grid structure, and then set the coordinates
The order of the coordinates is correct, otherwise the drawing will be messy.
points = np.random.rand(30000, 3)

mesh = pv.StructuredGrid()
# Set the coordinates from the numpy array
mesh.points = points
# set the dimensions
mesh.dimensions = [29, 32, 1]

# and then inspect it!
mesh.plot(show_edges=True, show_grid=True, cpos="xy")
The picture below is messy, because the coordinates are randomly generated and the order of the coordinates is chaotic.
Intelligent Recommendation
Mysql commonly used functions (4)-case function
For a summary of Mysql commonly used functions, see the following article The role of case The advanced version of if, similar to the one in Javaswitch ... case Match the value of the cas...
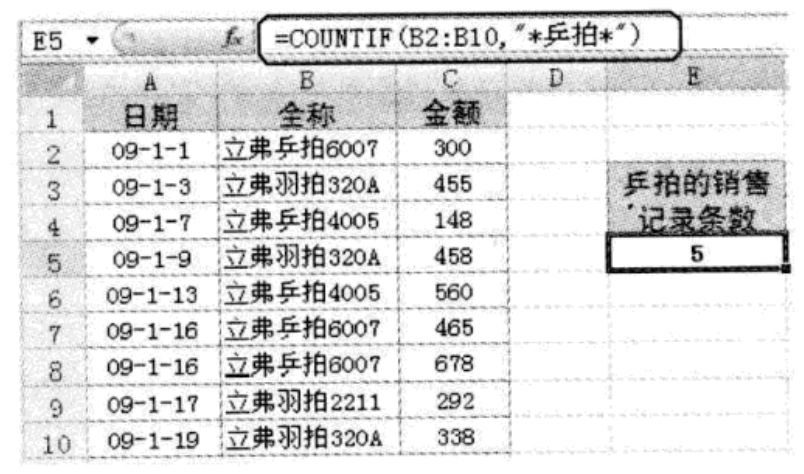
Some functions commonly used in work skills (4)
Use wildcards in the COUNTIF function: Return the top three data in the data table: LARGE function description: Returns the k-th largest value in the data set. Use this function to selec...
4. String processing functions commonly used in c
1>gets()withputs()//Keyboard reading and screen output of strings gets() is used to read the character string, using the line buffer, when you enter a character from the keyboard and press the Ente...

4 functions commonly used in C ++ STL
Articles directory algorithm 1.find() 2.count() 3.sort() 4.reverse() algorithm 1.find() Find the specified value and return to the iterator Function prototype Usage: Find (start location, end position...
More Recommendation
Commonly used dynamic pseudo-class selector functions and applications
Commonly used dynamic pseudo-class selector functions and applications E:link Link pseudo-class selector Select the matching E element, and the matching element is defined with a hyperlink and has not...

Second-level MS Office advanced applications--Excel commonly used functions
1. VLOOKUP function: This function is a search function, define a search target, it can search and return the desired found value from the specified area. Parameter 1: D3 (find target): Find the cell ...
Python list: List commonly used functions and instance applications
Little friends, it's good on the weekend, I'm cute, I appeared again. It's 1024 soon. I used to like to make fun so much before, but now I am only willing to stay in my warm house quietly. Maybe this ...
Introduction to Zookeeper (4) ------ Zookeeper commonly used api applications
zookeeper api application: 1. Create a maven project, pom introduces dependencies: Copy the log4j.properties file to the project root directory Need to create a new file in the src/main/resources dire...
PHP-[commonly used functions]-commonly used functions
Learning points URL encoding and decoding urlencode urldecode String length strlen When strlen is calculated, treat a UTF8 Chinese character as 3 lengths count function: count the length of the array ...