Visualization of 3D point cloud
3D point cloud visualization
pcl
matplotlib
import matplotlib.pyplot as plt
from mpl_toolkits.mplot3d import Axes3D
import numpy as np

points = np.loadtxt('0000000000.txt')
skip = 20   # Skip every n points

fig = plt.figure()
ax = fig.add_subplot(111, projection='3d')
point_range = range(0, points.shape[0], skip) # skip points to prevent crash
ax.scatter(points[point_range, 0],   # x
           points[point_range, 1],   # y
           points[point_range, 2],   # z
           c=points[point_range, 2], # height data for color
           cmap='spectral',
           marker="x")
ax.axis('scaled')  # {equal, scaled}
plt.show()
mayavi
import numpy as np

def viz_mayavi(points, vals="distance"):
    x = points[:, 0]  # x position of point
    y = points[:, 1]  # y position of point
    z = points[:, 2]  # z position of point
    # r = lidar[:, 3]  # reflectance value of point
    d = np.sqrt(x ** 2 + y ** 2)  # Map Distance from sensor

    # Plot using mayavi -Much faster and smoother than matplotlib
    import mayavi.mlab

    if vals == "height":
        col = z
    else:
        col = d

    fig = mayavi.mlab.figure(bgcolor=(0, 0, 0), size=(640, 360))
    mayavi.mlab.points3d(x, y, z,
                         col,          # Values used for Color
                         mode="point",
                         colormap='spectral', # 'bone', 'copper', 'gnuplot'
                         # color=(0, 1, 0),   # Used a fixed (r,g,b) instead
                         figure=fig,
                         )
    mayavi.mlab.show()

points = np.loadtxt('0000000000.txt')
viz_mayavi(points)
Intelligent Recommendation
Python-point cloud visualization
Code sample for point cloud feature visualization: reference: Processing point cloud data (3): 3D point cloud visualization https://blog.csdn.net/qq_33801763/article/details/78930167 Python allows sca...

Point cloud visualization of Open3D
Key function read_point_cloud(filename, format='auto', remove_nan_points=True, remove_infinite_points=True, print_progress=False) Role: Read the point cloud from the file. When the user does not fill ...
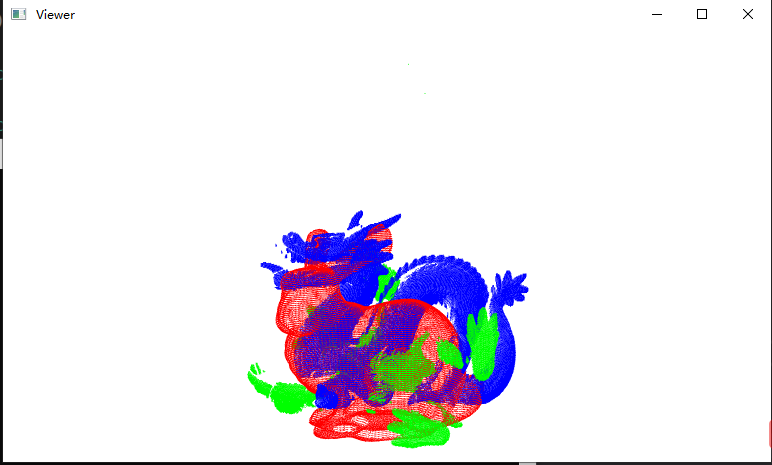
Multiple point cloud visualization
A result diagram shows multiple point cloud files Display three points clouds in a renderings Code result...
More Recommendation
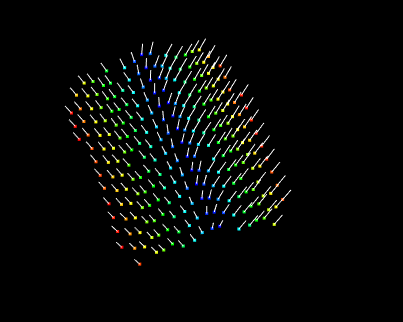
Point cloud method visualization
The self-belled vector estimation function in the PCL can also be used to estimate the approach. The following code shows how to use other methods estimate the method of use: ...
Point cloud visualization - PCLVisualizer
3D point cloud visualization can be visualized by methods such as RVIZ, Cloud_Viewer or PCLVisualizer, which describes how PCLvisualizer. The first is to load the point cloud and display: Create a poi...
Point cloud visualization (3)
Simple geometry point cloud added and display: Simple point cloud visualization: Commonly used point cloud visualization key code: Image form display depth data, color reflection depth: Draw function ...
3D point cloud representation
Original link Point cloud data structure The point cloud data structure is very simple, only three-dimensional coordinate information and normal information of the point. The following is an abstract ...