Processing point cloud data (3): 3D point cloud visualization
tags: Point cloud 3D Visualization KITTI
3D visualization point cloud
Visualize with Mayavi
First install mayavi using anaconda and open the command line interface
conda install mayaviIf the python version is py3, an error will occur, and the python2.7 version needs to be installed:
conda create -n py2 python=2Then install mayavi in the py2 environment:
conda install -n py2 mayaviIf the VTK version does not match, update VTK:
conda update -n py2 vtkThe directory of py2 is in D:\Anaconda\envs\py2, then use pycharm to switch the version:
import numpy as np

def viz_mayavi(points, vals="distance"):
    x = points[:, 0]  # x position of point
    y = points[:, 1]  # y position of point
    z = points[:, 2]  # z position of point
    # r = lidar[:, 3]  # reflectance value of point
    d = np.sqrt(x ** 2 + y ** 2)  # Map Distance from sensor

    # Plot using mayavi -Much faster and smoother than matplotlib
    import mayavi.mlab

    if vals == "height":
        col = z
    else:
        col = d

    fig = mayavi.mlab.figure(bgcolor=(0, 0, 0), size=(640, 360))
    mayavi.mlab.points3d(x, y, z,
                         col,          # Values used for Color
                         mode="point",
                         colormap='spectral', # 'bone', 'copper', 'gnuplot'
                         # color=(0, 1, 0),   # Used a fixed (r,g,b) instead
                         figure=fig,
                         )
    mayavi.mlab.show()

points = np.loadtxt('0000000000.txt')
viz_mayavi(points)
Visualize with Matplotlib
Pycharm switches back to the py3 version:
import matplotlib.pyplot as plt
from mpl_toolkits.mplot3d import Axes3D
import numpy as np

points = np.loadtxt('0000000000.txt')
skip = 20   # Skip every n points

fig = plt.figure()
ax = fig.add_subplot(111, projection='3d')
point_range = range(0, points.shape[0], skip) # skip points to prevent crash
ax.scatter(points[point_range, 0],   # x
           points[point_range, 1],   # y
           points[point_range, 2],   # z
           c=points[point_range, 2], # height data for color
           cmap='spectral',
           marker="x")
ax.axis('scaled')  # {equal, scaled}
plt.show()
Special note: This article has taken notes for my study.
Specific reference:http://ronny.rest/tutorials/module/pointclouds_01/point_cloud_birdseye/
Intelligent Recommendation
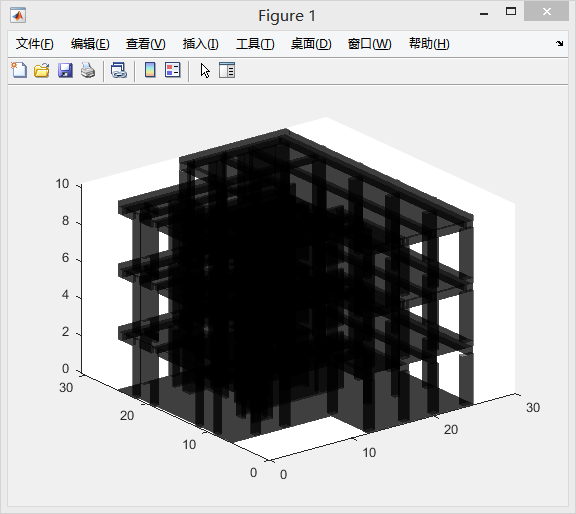
[MATLAB] Point cloud data processing program visualization implementation 2
Foreword The last article is a reading and display of point clouds. The project is also related to the needs of the three-dimensional model. This mainly writes this Tip: The following is the textual c...
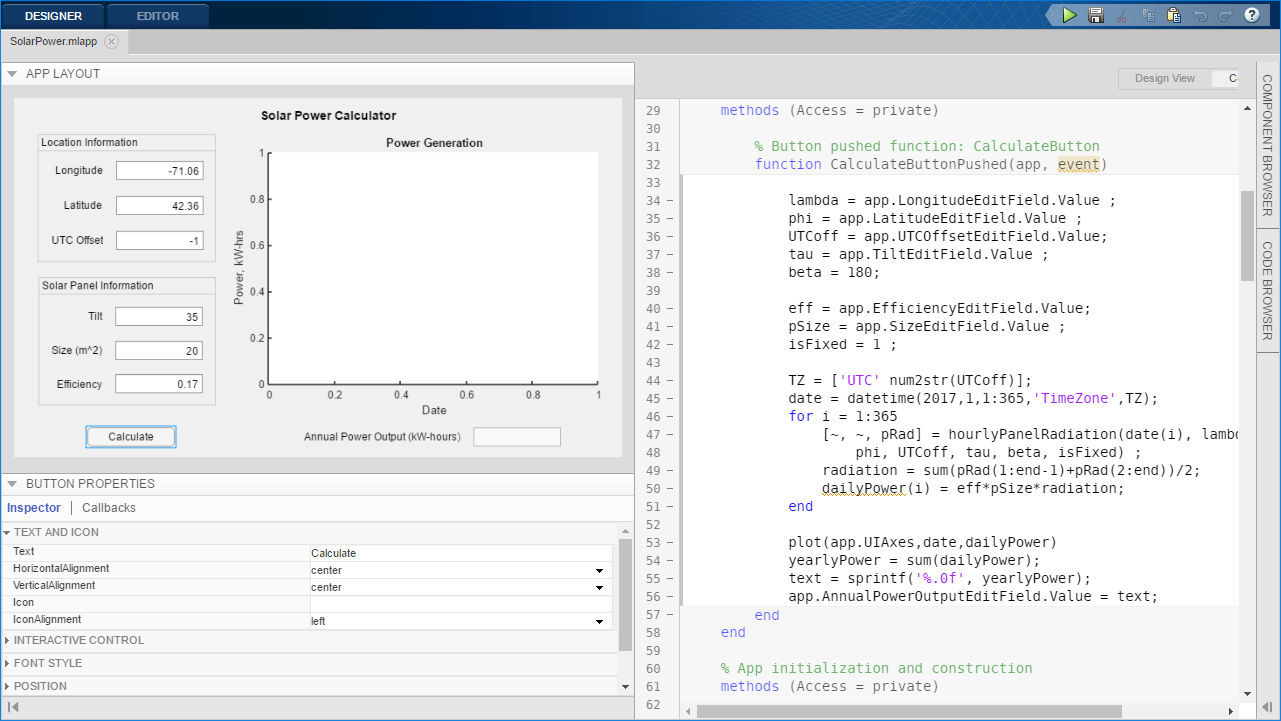
[MATLAB] Point cloud data processing program visualization implementation 1
Tip: After the article is written, the directory can be automatically generated, how to generate the help documentation that can refer to the right. Article catalog Foreword First, Matlab App Designer...
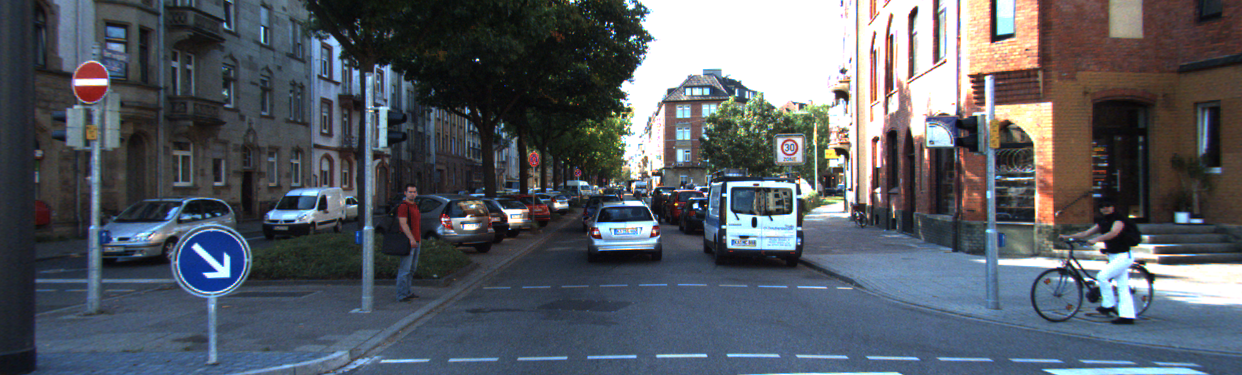
AVOD: The processing and visualization of point cloud data and bev diagram
Articles directory Foreword 1. Point cloud data visualization 2. Point cloud data calibration 3. Turn to BEV diagram Conclusion Foreword The main record in this articleAVODThe learning and understandi...

【Overview】 Research content of 3D computing vision and point cloud data processing
Transfer from: Three-dimensional computational vision research content includes: (1) Three-dimensional matching: matching between two or more frames of point cloud data. Because the laser scanning bea...
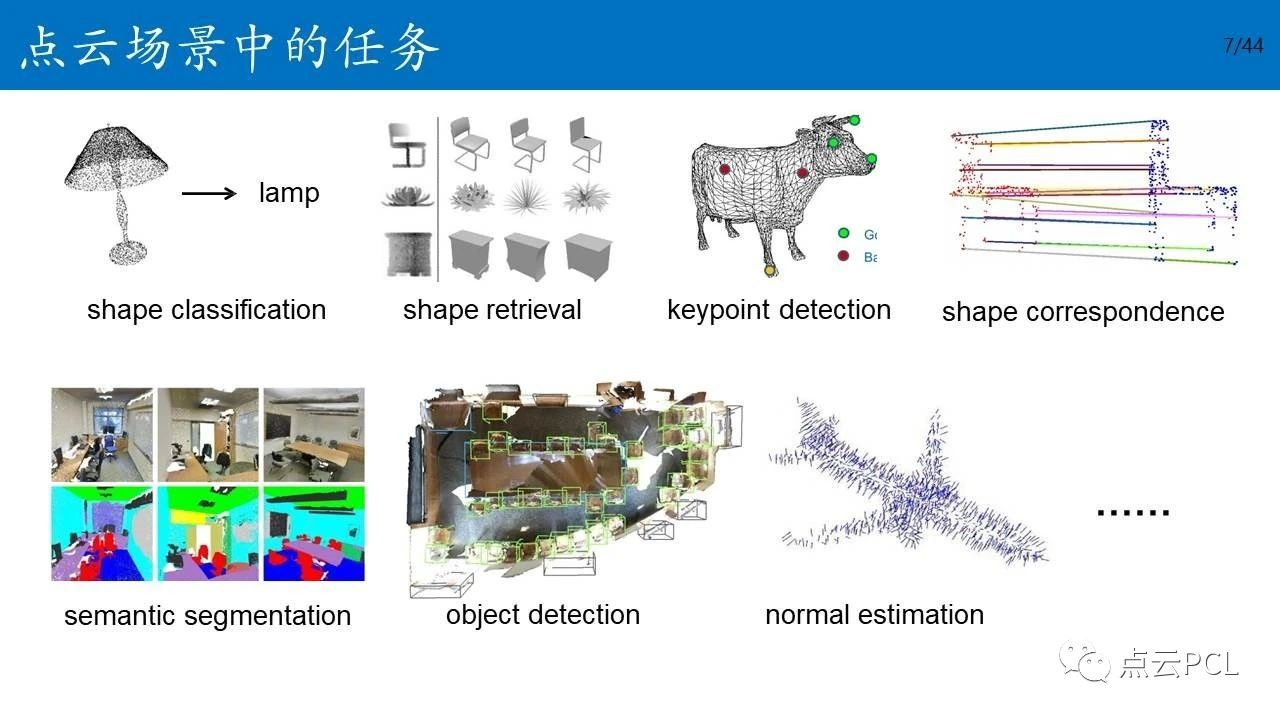
3D Point Cloud | Introduction to Point Cloud Data Processing Based on Deep Learning Classics: PointNet, PointNet++
Click above "AI algorithm training camp",select"Star"the public Selected works, delivered immediately Preface Unlike the representation of image data in a computer, which usually e...
More Recommendation
Application of deep learning in the 3D point cloud processing
A. The nature of the point cloud 1. disorder (results independent of the input order, the same configuration) 2. sparsity, noise ... 3. a geometric rotation robustness (translation, rotation, scale an...
3D point cloud processing 06-IOU calculation
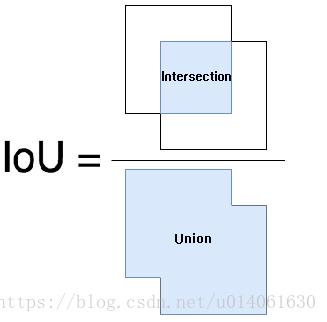
3D point cloud processing 06-IOU calculation IOU definition: The predictive border and the truth of the border and the ratio First, the calculation of IOU is not required to classify various situation...
3D point cloud processing 07-binary tree
3D point cloud processing 07-binary tree Python realizes the construction of binary tree Recursive realization of the binary tree node: advantage: More easily understood and realized Short code shortc...
3D point cloud processing - NMS code implementation
3D point cloud processing - NMS code implementation...
3D point cloud processing 08-kdtree
3D point cloud processing 08-kdtree result_set.py kdtree.py...