k8s deployment kube-prometheus
tags: Prometheus kubernetes docker
Table of contents
-
- Preface
- Review the prometheus architecture diagram
- illustrate
- Download the kube-prometheus installation package
- Expose Prometheus' svc port
- Modify Prometheus' container time - failed
- Visit prometheus
- Visit grafana, dashboard N/A problem investigation ideas
- What is the relationship between two Prometheus containers, highly available?
- What is kube-state-metrics
- Configure prometheus and grafana data persistence
- Problem handling
- Uninstall kube-prometheus
- Interpreting servicemonitors resources
- Create servicemonitors to implement custom monitoring
- Manually access the metrics interface of the k8s component
- Prometheus configuration file
- Learn about Prometheus' service discoveries
- Alarm rules
- Comparison of Prometheus and kube-promethus in binary deployment
Preface
environment:centos7.9、k8s-v1.22.6、kube-prometheus-release-0.10.zip
Review the prometheus architecture diagram
Let's review the architecture of prometheus:
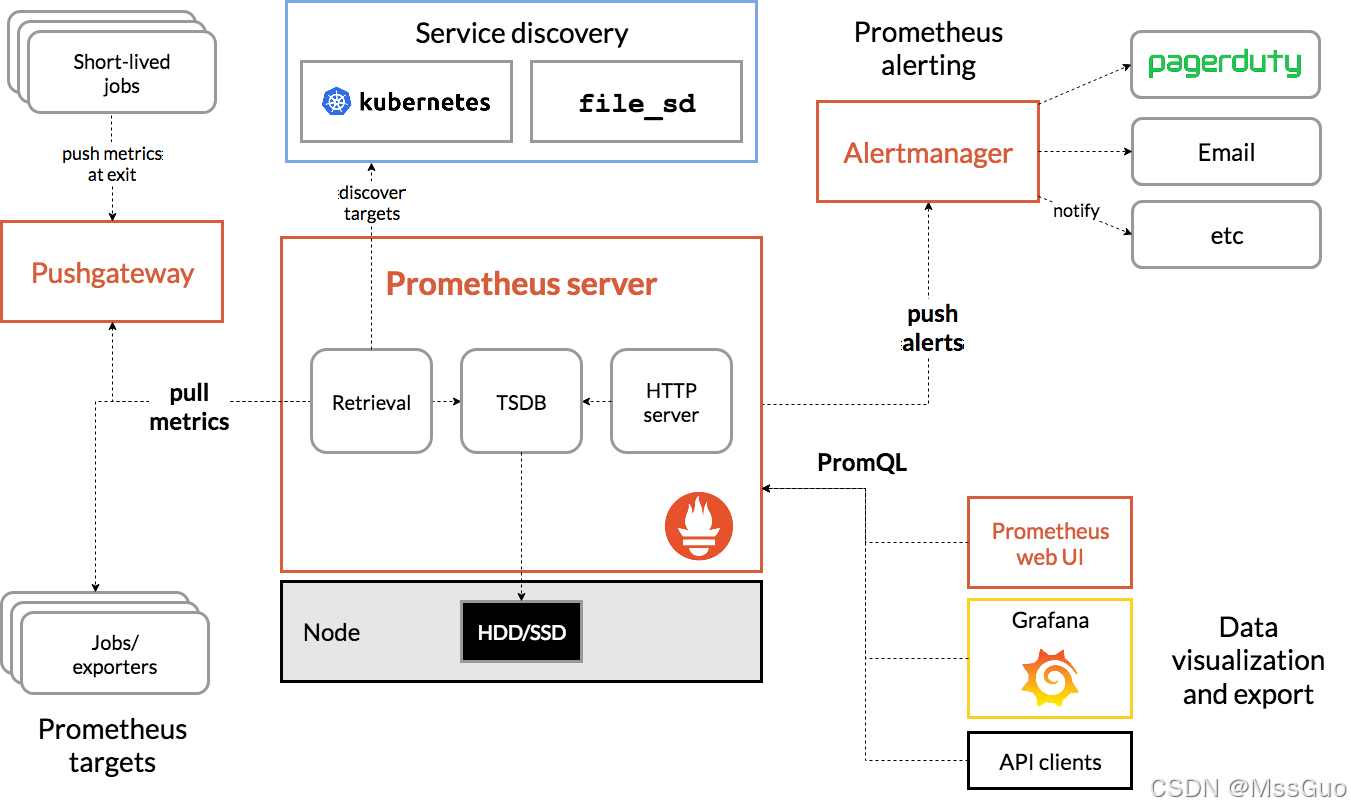
Let's interpret the architecture diagram of prometheus:
1. Prometheus server is the most important core part. It uses a database called TSDB (time series database) as storage.
2. TimeSeries Data: Data that records changes in system and device status in chronological order are called time series data.
3. prometheus can obtain data in two ways. One is to actively pull data, that is, pull pull the data indicators of the target object. The other is to write a collection script on the target host and push the data to pushgateway. The pushgateway pushes the data to Prometheus Server. In most cases, we recommend prometheus to use pull to actively pull data, which can reduce the business burden of the target host and hand over the burden to prometheus server.
4. What data does the prometheus server need to pull? We can statically configure the target host to pull in the prometheus server, or we can use the automatic service discovery function of prometheus to automatically obtain the target host. In k8s, the service discovery mechanism will be used to automatically configure the target host.
5. Prometheus has obtained the indicator data and needs to define the alarm rules. Then, an alarm is generated according to the construction rules. Prometheus will push the alarm to altermanager (the altermanager's host IP address port is defined in the configuration file of prometheus), and altermanager will send alarm information to communication tools such as email, DingTalk, WeChat, etc.
6. The web UI of prometheus is not very beautiful, so it needs a graphical interface that displays data friendly. Grafana is used to display data. Grafana displays friendly graphical pages by obtaining the data of prometheus server.
illustrate
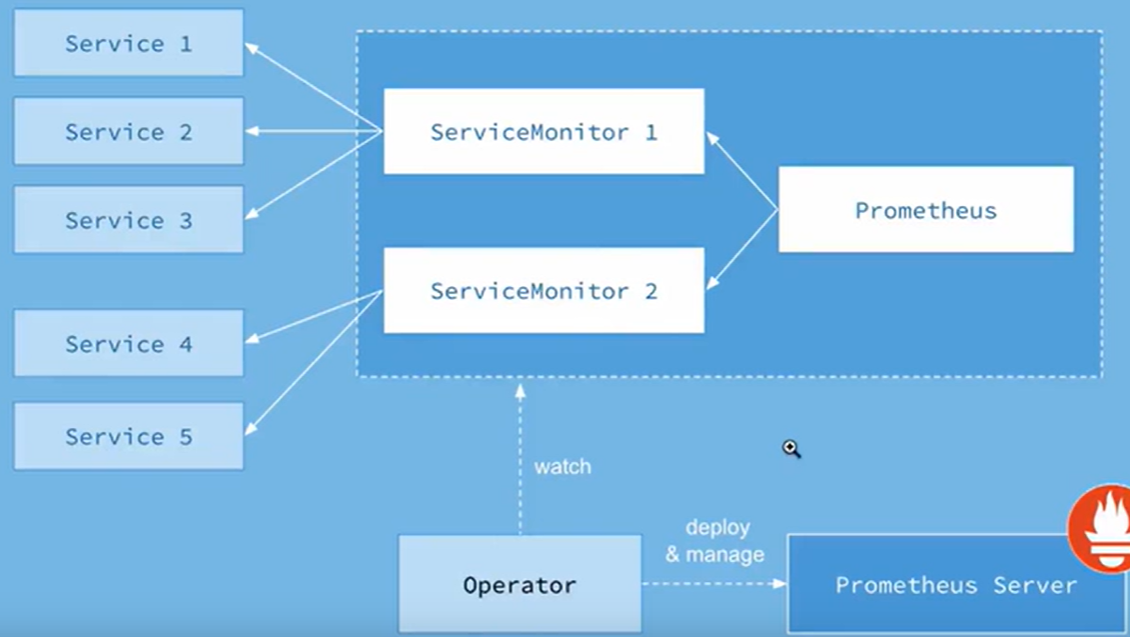
We adoptprometheus-operatorInstall on k8s clusterprometheusMonitoring software, the software for this project is on GitHub;

There are two projects under coreos on github:kube-prometheus and prometheus-operator, both can be achievedprometheus creation and management.
It should be noted thatkube-prometheus The configuration operation on it is also based onprometheus-operator and provides a large number of default configurations, so the one used here iskube-prometheus Project configuration.
In addition, you need to pay attention to the k8s version requirements before using it and find the corresponding onekube-prometheus Version.

Download the kube-prometheus installation package
gohttps://github.com/prometheus-operator/kube-prometheus/tree/release-0.10download kube-prometheus-release-0.10.zipCompress the package, upload to the server.
mkdir /root/kube-prometheus
cd /root/kube-prometheus
unzip kube-prometheus-release-0.10.zip
cd /root/kube-prometheus/kube-prometheus-release-0.10
#See which images are needed for these yaml files
find ./manifests -type f | xargs grep 'image: '|sort|uniq |awk '{print $3}'|grep ^[a-zA-Z]grep -Evw
quay.io/prometheus/alertmanager:v0.23.0
jimmidyson/configmap-reload:v0.5.0
quay.io/brancz/kube-rbac-proxy:v0.11.0
quay.io/prometheus/blackbox-exporter:v0.19.0
grafana/grafana:8.3.3
k8s.gcr.io/kube-state-metrics/kube-state-metrics:v2.3.0
quay.io/brancz/kube-rbac-proxy:v0.11.0
quay.io/brancz/kube-rbac-proxy:v0.11.0
quay.io/prometheus/node-exporter:v1.3.1
k8s.gcr.io/prometheus-adapter/prometheus-adapter:v0.9.1
quay.io/brancz/kube-rbac-proxy:v0.11.0
quay.io/prometheus-operator/prometheus-operator:v0.53.1
quay.io/prometheus/prometheus:v2.32.1
# You can download the mirror first, and find that 2 of them cannot be pulled down, so I found the following method to solve it:
# Failed image
k8s.gcr.io/prometheus-adapter/prometheus-adapter:v0.9.1
k8s.gcr.io/kube-state-metrics/kube-state-metrics:v2.3.0

#Plain mirror
docker pull lbbi/prometheus-adapter:v0.9.1
docker pull bitnami/kube-state-metrics:latest
# For images that cannot be downloaded, you can try adding m.daocloud.io, such as m.daocloud.io/k8s.gcr.io/prometheus-adapter/prometheus-adapter:v0.9.1

# Tag replacement
docker tag lbbi/prometheus-adapter:v0.9.1     k8s.gcr.io/prometheus-adapter/prometheus-adapter:v0.9.1
docker tag bitnami/kube-state-metrics:latest  k8s.gcr.io/kube-state-metrics/kube-state-metrics:v2.3.0
#Official installation
kubectl apply --server-side -f manifests/setup
kubectl wait \
	--for condition=Established \
	--all CustomResourceDefinition \
	--namespace=monitoring
kubectl apply -f manifests/

# Interpretation
# manifests/setup/ directory is the yaml resource manifest file that creates monitoring namespace and creates custom resource CRD
# manifests/ directory has a large number of yaml files, which are used to create prometheus components, such as sts/deloyment/servicemonitors/svc/alertmanagers/prometheusrules waiting for resource files
#--server-side option tells Kubernetes to perform operations on the server side, not on the client side, and is usually used to ensure that the cluster state is consistent with the configuration file.
The #kubectl wait command waits for all CustomResourceDefinition resources to reach the Established state in the specified monitoring namespace
Expose Prometheus' svc port
InstalledprometheusofserviceyesClusterIPType, so in order to be accessible from the external network, the simple modification here isNodePortType (the production environment exposes the port according to actual conditions), and then access from the browser:
# Modify the svc type to NodePort
kubectl -n monitoring edit  svc prometheus-k8s
kubectl -n monitoring edit svc  grafana
kubectl -n monitoring edit svc  alertmanager-main
#Check the NodePort port exposed by the service:
kubectl -n monitoring get svc  | grep -i nodeport
Modify Prometheus' container time - failed
The time inside the prometheus-k8s-0 and prometheus-k8s-1 containers after startup is incorrect and needs to be modified to server time:
#Edited sts online
kubectl  -n monitoring  edit sts prometheus-k8s
  containers:
  - name: mycontainer
    image: myimage
    volumeMounts:
    - mountPath: /etc/localtime		# Add a mount point
      name: localtime
  volumes:
  - name: localtime					#Add a mounted volume
    hostPath:
      path: /etc/localtime
      type: File
# Restart pod
kubectl  -n monitoring  delete  pod prometheus-k8s-0
kubectl  -n monitoring  delete  pod prometheus-k8s-1
# After discovering that the statefulset set localtime to mount the volume, it was restored again. It should be restored by the custom resource prometheus called k8s, because it is the statefulset it controls.
# I don't know how to modify the container time here.
Visit prometheus
http://192.168.118.133:32539       #Access prometheus
http://192.168.118.133:31757       #Accessing grafana, the k8s cluster has been monitored by default, the default account password is admin/admin
http://192.168.118.133:31206 	   #Access alertmanager
Visit grafana, dashboard N/A problem investigation ideas
Browser access grafana: http://192.168.118.133:31757 admin/admin
 There are already many dashboards built in the square icon on the left-Browse-Default directory. All can be used directly.
 If you find that you don't have the dashboard you want, you can go to the official website of grafan to download: https://grafana.com/grafana/dashboards
 For example, if the granfan installed by default does not have a kube-state-metrics monitoring panel, go to https://grafana.com/grafana/dashboards to search
kube-state-metrics, then download the JSON file and import it on the grafana page. Just import the dashboardID 17519 online here.
 Similarly, when you need redis and mysql monitoring panels, you can download them on the official website and import them on grafana.

# Problem investigation-Thoughts
 When we import a redis dashboard, and then some data is N/A, indicating that the data is empty, there must be a problem. You can edit this panel to see what its specific PromQL expression is.
 Then copy and paste the expression on the Prometheus web page to check whether there is data. At the same time, to determine whether this indicator exists, the indicator written by the redis dashboard you downloaded is in your
 There is no existence or the name difference in the redis version, so the data will definitely not be obtained.
 Go to the server curl redis-exporter-IP:9014/metrics | grep 'index'  Actually see if the indicator exists or has numerical values.
 That's how to troubleshoot problems
What is the relationship between two Prometheus containers, highly available?
We found that after the deployment is completed, two Prometheus instances were created, namely prometheus-k8s-0 and prometheus-k8s-1. But what is the relationship between these two containers? Looking at the yaml manifest file and the container startup command of statefulset, we did not find any relationship between master and slave and master or backup, nor did we find any high-capacity relationship. It seems that the two prometheus-k8s-0 and prometheus-k8s-1 are separate instances because they all have their own PVCs. So, what is the relationship between them?
# Test Verification
# Set all nodes to be scheduled first
kubectl cordon master
kubectl cordon node1
kubectl cordon node2
# Delete the prometheus-k8s-1 container. At this time, the prometheus-k8s-1 pod is pulled up and is already in the penging state.
kubectl -n monitoring delete pod prometheus-k8s-1
# master node simulates high load
cat > TestCpu.java <<'EOF'
public class TestCpu {
public static void main(String[] args) {
cpu();
}
private static void cpu(){
while (true) {
System.out.println("66666");
}
}
}
EOF
java TestCpu.java
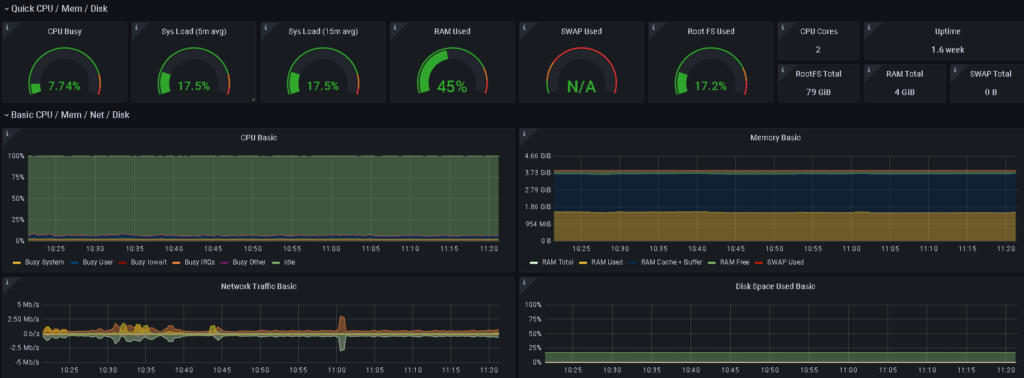
# Log in to grafana, set the query time range to one hour, observe the master node load and take screenshots and record
# Set master to scheduleable, at this time the prometheus-k8s-1 pod will be created
kubectl uncordon master
#Set master to non-scheduled
kubectl cordon master ;
# Delete the prometheus-k8s-0 pod, and only the prometheus-k8s-1 pod is running normally
kubectl -n monitoring delete pod prometheus-k8s-0
# master node simulates high load
java TestCpu.java
# Log in to grafana, set the query time range to one hour, observe the master node load and compare it with the screenshot in the previous step
# We found that at the same time, the two loads were different
# This shows that the underlying layer is two unused TSDBs, so it should be explained that prometheus-k8s-0 and prometheus-k8s-0 are completely two different Prometheus instances.
What is kube-state-metrics
After deploying kube-prmoethus, we found that there is a pod like kube-state-metrics. What does this pod do? Is it the same as our previous metrics-server?
Answer: kube-state-metrics is used to expose the overall data metrics of the k8s cluster, allowing Prometheus to monitor the k8s cluster, such as the number of pods, the number of namespaces, the information CPU, content capacity of the k8s cluster, etc. The metrics-server we deployed before was used for the command line kubectl top. So these two are different.
#Can get the indicator data through the IP interface of curl kube-state-metrics pod
curl -s -k -H "Authorization: Bearer $token" https://10.244.0.48:8443/metrics
kube-state-metrics: It collects status information about various resources in Kubernetes (such as nodes, pods, services, etc.) by querying Kubernetes' API servers, and converts this information into metrics that Prometheus can use
kube-state-metrics main functions:
Node status information: such as node CPU and memory usage, node status, node label, etc.
 Pod status information, such as Pod status, container status, container image information, Pod tags and comments, etc.
 Status information of controllers such as Deployment, Daemonset, Statefulset and ReplicaSet, such as number of replicas, status of replicas, creation time, etc.
 Service status information, such as service type, service IP and port, etc.
 Status information of the storage volume, such as storage volume type, storage volume capacity, etc.
 Kubernetes' API server status information, such as the status of the API server, number of requests, response time, etc.
So, in a simple sentence, kube-state-metrics is used to expose the state information of the k8s cluster. These information data metrics will be crawled by Prometheus for Prometheus to monitor the Kubernetes cluster, discover problems, and early warnings.
Configure prometheus and grafana data persistence
Refer to another article:https://blog.csdn.net/MssGuo/article/details/127891331
Prometheus data persistence
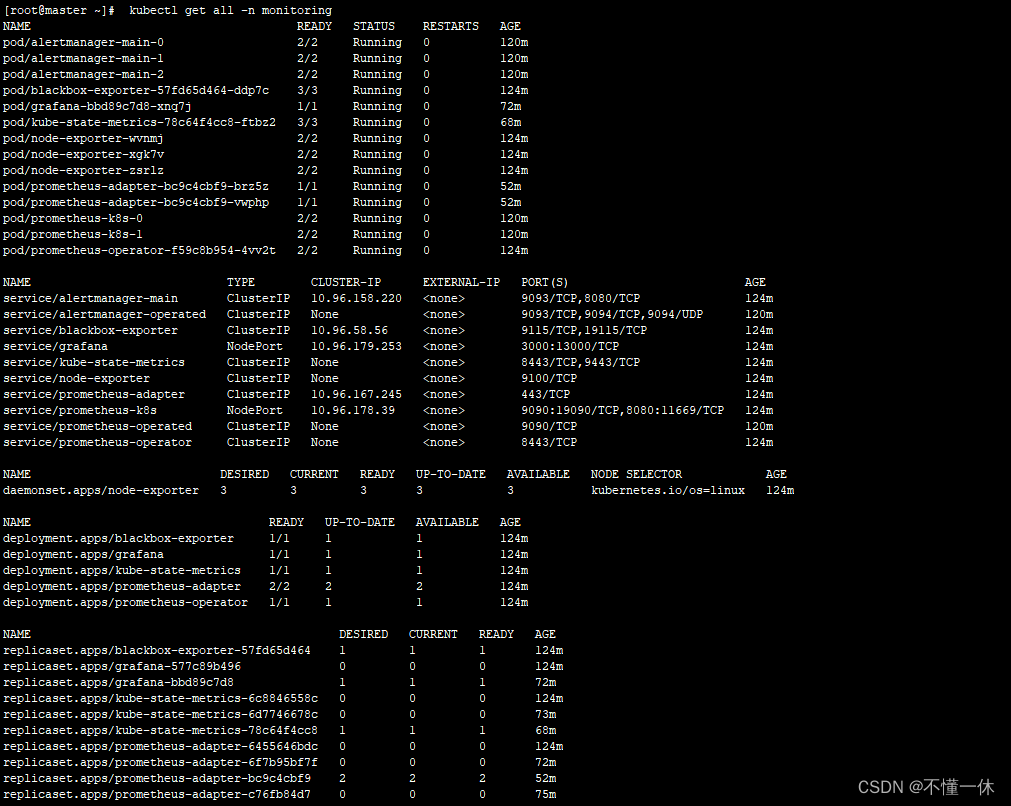
[root@matser manifests]# kubectl get pods -n monitoring
NAME                                   READY   STATUS    RESTARTS   AGE
........................
prometheus-k8s-0                       2/2     Running   0          68m	#This is the pod that is really running prometheus-server
prometheus-k8s-1                       2/2     Running   0          68m	#This is the pod that is really running prometheus-server
# From this we know that the main service of prometheus is actually started using pod, which is actually prometheus-k8s-0 and prometheus-k8s-1
[root@matser manifests]#  kubectl get sts -n monitoring
NAME                READY   AGE
alertmanager-main   3/3     69m
prometheus-k8s      2/2     69m		#this
# But we checked it and found that the yaml file that created the kube-prometheus did not create the StatefulSet resource, which is very strange.
# Later, Baidu discovered that it actually officially defined a resource called prometheus, which created a StatefulSet, as follows:
 [root@matser manifests]#  kubectl get prometheus -n monitoring
NAME   VERSION   REPLICAS   AGE
k8s    2.32.1    2          71m		#This kind of prometheus resource, the file that creates the sts created by it, is prometheus-prometheus.yaml
[root@matser manifests]#

# prometheus-server Data persistence is not configured by default. So we need to do persistent storage.
#Modify the resource of prometheus online, the name is k8s (of course, you can also modify prometheus-prometheus.yaml and then apply it too)
[root@matser manifests]#  kubectl  edit prometheus k8s  -n monitoring
apiVersion: monitoring.coreos.com/v1
kind: Prometheus
.....................
  replicas: 2
  resources:
    requests:
      memory: 400Mi
  retention: 15d		#Add this parameter to indicate the number of days when prometheus data is retained, and the default is only 1 day.
  ruleNamespaceSelector: {}
  ............
  serviceMonitorNamespaceSelector: {}
  serviceMonitorSelector: {}
  storage:										#Add to the following paragraph, a total of 9 sentences
    volumeClaimTemplate:
      spec:
        accessModes:
        - ReadWriteOnce
        resources:
          requests:
            storage: 50M
        storageClassName: nfs-storageclass		#Specify the existing storage class name
  version: 2.32.1
[root@matser manifests]#

# Check pvc, all pvs have been created
kubectl  get pvc,pv -n monitoring
Data persistence of grafana
[root@matser ~]# kubectl  get deploy -n monitoring
NAME                                  READY   UP-TO-DATE   AVAILABLE   AGE
deployment.apps/grafana               1/1     1            1           110m
#Above we see that grafana is deployed using deployment, with only one pod.

#Create grafana's pvc manually
[root@matser manifests]# cat > grafana-pvc.yaml <<'EOF'
apiVersion: v1
kind: PersistentVolumeClaim
metadata:
  name: grafana-pvc
  namespace: monitoring
spec:
  accessModes:
  - ReadWriteMany
  resources:
    requests:
      storage: 100M
  storageClassName: nfs-storageclass
EOF
kubectl  apply  -f grafana-pvc.yaml
kubectl  get pvc -n monitoring  | grep grafana
kubectl  get pv | grep grafana
#Edit grafana's yaml file, of course you can edit it online
[root@matser manifests]# vim grafana-deployment.yaml
      volumes:
# - emptyDir: {} #Comment or delete
# name: grafana-storage #Comment or delete
      - name: grafana-storage			#Note that the name should be the same as the above sentence
        persistentVolumeClaim:
         claimName: grafana-pvc			#Specify the pvc we just created
      - name: grafana-datasources		#This original, don't care
        secret:
          secretName: grafana-datasources

# You can not do the following step, because the password changes will not be lost after persisting above
#In order to fix the login password of grafana, you can add environment variables
       readinessProbe:
          httpGet:
            path: /api/health
            port: http
        env:								#Add environment variables
        - name: GF_SECURITY_ADMIN_USER		#Add environment variables
          value: admin						#Add environment variables
        - name: GF_SECURITY_ADMIN_PASSWORD	#Add environment variables
          value: admin						#Add environment variables
        resources:
          limits:
            cpu: 200m
            memory: 200Mi

kubectl  replace  -f grafana-deployment.yaml
Problem handling
Visit the following url and found thatkube-controller-managerandkube-schedule 。

Enter ourshttp://192.168.118.133:31757 , visit grafana and found that grafana is not monitoredkube-controller-managerandkube-schedule These two cluster components.

Solve the issue where prometheus does not monitor kube-controller-manager and kube-schedule
Cause analysis:
andprometheusDefinedServiceMonitorResources related.
Let's check the resource list file in the installation directory.kube-schedulerThe resource list corresponding to the component is found:
#Enter into the directory where we installed prometheus
[root@master ~]# cd /root/kube-prometheus/kube-prometheus-release-0.10/manifests
#View this kubernetesControlPlane-serviceMonitorKubeScheduler.yaml resource list
# This prometheus custom resource ServiceMonitor type, whose tag selector is an svc
[root@master manifests]# cat  kubernetesControlPlane-serviceMonitorKubeScheduler.yaml
apiVersion: monitoring.coreos.com/v1
kind: ServiceMonitor
metadata:
  labels:
    app.kubernetes.io/name: kube-scheduler
    app.kubernetes.io/part-of: kube-prometheus
  name: kube-scheduler
  namespace: monitoring
spec:
  endpoints:
  - bearerTokenFile: /var/run/secrets/kubernetes.io/serviceaccount/token
    interval: 30s
    port: https-metrics
    scheme: https
    tlsConfig:
      insecureSkipVerify: true
  jobLabel: app.kubernetes.io/name
  namespaceSelector:			#namespace selector
    matchNames:
    - kube-system
  selector:						#Tag Selector
    matchLabels:
      app.kubernetes.io/name: kube-scheduler

#I found that the tag selector under the namespace defined above has no corresponding svc on the matching
[root@master manifests]# kubectl get svc -l app.kubernetes.io/name=kube-scheduler -n kube-system
No resources found in kube-system namespace.		#No svc resource matching
[root@master manifests]#


#Let's check the corresponding controller-manager resource list again. The same problem is the same. There is no svc resource matching.
[root@master manifests]# tail kubernetesControlPlane-serviceMonitorKubeControllerManager.yaml
    scheme: https
    tlsConfig:
      insecureSkipVerify: true
  jobLabel: app.kubernetes.io/name
  namespaceSelector:
    matchNames:
    - kube-system
  selector:
    matchLabels:
      app.kubernetes.io/name: kube-controller-manager

#I found that there was no corresponding service at all
[root@master manifests]# kubectl get svc -l app.kubernetes.io/name=kube-controller-manager -n  kube-system
No resources found in kube-system namespace.
[root@master manifests]#
Solution: manually create the corresponding svc, so that the ServiceMonitor resource defined by the prometheus has a corresponding service, and the service is associated with the pod through the tag selector.
#So now we need to actively create an svc for it so that it can monitor the kube-scheduler
[root@master ~]# cd /root/kube-prometheus/kube-prometheus-release-0.10/manifests/repair-prometheus
[root@master repair-prometheus]# cat kubeSchedulerService.yaml
apiVersion: v1
kind: Service
metadata:
  labels: #Define the tag of this service, because the tag is defined in kubernetesControlPlane-serviceMonitorKubeScheduler.yaml
      app.kubernetes.io/name: kube-scheduler
  name: kube-scheduler
  namespace: kube-system		#The namespace is kube-system
spec:
  selector:						#This tag selector means we want to associate it to the pod of kube-scheduler
    component: kube-scheduler	# kubectl get  pods kube-scheduler-master -n kube-system --show-labels
  ports:
  - name: https-metrics			#service port name, this name must be consistent with the port name of ServiceMonitor
    port: 10259
    targetPort: 10259			#kube-scheduler-master port
[root@master repair-prometheus]#


#Similarly, we also need to actively create an svc for it so that it can monitor the controller-manager
[root@master repair-prometheus]# cat kubeControllermanagerService.yaml
apiVersion: v1
kind: Service
metadata:
  labels: #Define the tag of this service, because this tag is defined in kubernetesControlPlane-serviceMonitorKubeControllerManager.yaml
      app.kubernetes.io/name: kube-controller-manager
  name: kube-controller-manager
  namespace: kube-system 				#The namespace is kube-system
spec:
  selector: 							#This tag selector means we want to associate it to the pod of kube-controller-manager-master
    component: kube-controller-manager	#kubectl get pods kube-controller-manager-master -n kube-system --show-labels
  ports:
  - name: https-metrics					#service port name, this name must be consistent with the port name of ServiceMonitor
    port: 10257
    targetPort: 10257					# kube-controller-manager-master pod port
[root@master repair-prometheus]#

# Create the above two services
[root@master repair-prometheus]# kubectl apply  -f kubeSchedulerService.yaml  -f kubeControllermanagerService.yaml
After creating the service, we found that the interface of grafana still does not monitor Scheduler and Controllermanager services, and there is another step:
#And another point, the default bound address of the two pods, kube-scheduler-master and kube-controller-manager, is 127.0.0.1, so Prometheus accesses through IP
# will be rejected, so we need to modify it. We know that these two system components are started in static pods, so we enter the static pod directory of the master node.
# If we do not specify where the static pod directory is, we can view it through kubelet
[root@master manifests]# systemctl  status kubelet.service | grep '\-\-config'
           └─429488 /usr/bin/kubelet --bootstrap-kubeconfig=/etc/kubernetes/bootstrap-kubelet.conf --kubeconfig=/etc/kubernetes/kubelet.conf --config=/var/lib/kubelet/config.yaml --network-plugin=cni --pod-infra-container-image=registry.aliyuncs.com/google_containers/pause:3.5

[root@master manifests]# grep static /var/lib/kubelet/config.yaml
staticPodPath: /etc/kubernetes/manifests						#This is the directory of static pods
[root@master manifests]#

[root@master ~]# cd /etc/kubernetes/manifests
[root@master manifests]# grep 192 kube-scheduler.yaml
    - --bind-address=192.168.118.131	#Modify 127.0.0.1 as the host ip, and modify it to 0.0.0.0 as well
        host: 192.168.118.131			#In fact, it is OK to keep the default 127.0.0.1
        host: 192.168.118.131			#In fact, it is OK to keep the default 127.0.0.1
[root@master manifests]#

[root@master manifests]# vim kube-controller-manager.yaml
    - --bind-address=192.168.118.131	#Modify 127.0.0.1 as the host ip, and modify it to 0.0.0.0 as well
        host: 192.168.118.131			#In fact, it is OK to keep the default 127.0.0.1
        host: 192.168.118.131			#In fact, it is OK to keep the default 127.0.0.1
[root@master manifests]#

#I found that the scheduler and controller-manager pods disappeared after modification, and the pod has not been recreated
#So the pods are normal after restarting the kubelet
[root@master manifests]# systemctl  restart kubelet.service
Now the interface of grafana has been monitored to the Scheduler and Controllermanager services.
Uninstall kube-prometheus
If you don't need kube-prometheus and directly delete the resources created by the corresponding resource list:
[root@master ~]# cd /root/kube-prometheus/kube-prometheus-release-0.10/
[root@master ~]# kubectl delete  -f manifests/
[root@master ~]#  kubectl delete  -f manifests/setup/
At this point, all system components have been monitored by kube-prometheus and kube-prometheus has been built.
Interpreting servicemonitors resources
# We found that kube-prometheus implements monitoring by defining an object called ServiceMonitor, and ServiceMonitor defines its corresponding service, and the service has endpoint and endpoint associated pod
# Here we introduce a redis servicemonitors as an example
[root@dev-master ~]# kubectl  -n monitoring  get  servicemonitors.monitoring.coreos.com  redis-exporter  -oyaml
apiVersion: monitoring.coreos.com/v1
kind: ServiceMonitor	# This is kube-prometheus custom CRD
metadata:
  annotations:
    meta.helm.sh/release-name: redis
    meta.helm.sh/release-namespace: monitoring
  labels:
    app: redis-exporter
    app.kubernetes.io/managed-by: Helm
  name: redis-exporter
  namespace: monitoring
spec:
  endpoints:				# endpoints define endpoints
  - interval: 60s			# Collection time, collect once every 60s seconds
    path: /metrics			# The path interface collected is /metrics
    scrapeTimeout: 10s		# Timeout
    targetPort: 9121		# service corresponding target port
  jobLabel: redis-exporter
  namespaceSelector:		#service namespace selector
    matchNames:
    - monitoring
  selector:					# Which service to match
    matchLabels:
      app: redis-exporter
# From this, let's interpret this ServiceMonitor, which means matching the 9121 port /metrics interface with the label app=redis-exporter service in the monitoring namespace
[root@dev-master ~]# kubectl  -n monitoring  get  svc -l app=redis-exporter
NAME             TYPE        CLUSTER-IP      EXTERNAL-IP   PORT(S)    AGE
redis-exporter   ClusterIP   10.102.22.146   <none>        9121/TCP   99m
Prometheus creates a lot of servicemonitoring by default, so there are many targets monitoring items on the page by default:
[root@master manifests]# kubectl  -n  monitoring  get servicemonitors.monitoring.coreos.com
NAME                      AGE
alertmanager-main         4d4h
blackbox-exporter         4d4h
coredns                   4d4h
grafana                   4d4h
ingress-nginx             3d21h
kube-apiserver            4d4h
kube-controller-manager   4d4h
kube-scheduler            4d4h
kube-state-metrics        4d4h
kubelet                   4d4h
node-exporter             4d4h
prometheus-adapter        4d4h
prometheus-k8s            4d4h
prometheus-operator       4d4h
Create servicemonitors to implement custom monitoring
Below, we give three examples to implement monitoring.
Prometheus monitoring kube-proxy
We found that prometheus does not monitor kube-proxy by default, and kube-proxy itself exposes the data metric interface.
Here we can refer to the above example to manually create servicemonitors to monitor kube-proxy.
# There are no kube-proxy servicesmonitors
kubectl -n monitoring get servicemonitors.monitoring.coreos.com
# First check what the data metric port of kube-proxy is
netstat -lntup| grep kube-proxy
tcp 0 0 127.0.0.1:10249 0.0.0.0:* LISTEN 4528/kube-proxy
tcp6 0 0 :::10256 :::* LISTEN 4528/kube-proxy
# You can collect indicator data
curl -s http://127.0.0.1:10249/metrics | head -n 3
# If you find that kube-proxy has no corresponding service, create a
cat > svc-kube-pxory.yaml <<'EOF'
apiVersion: v1
kind: Service
metadata:
name: kube-proxy
namespace: kube-system
spec:
ports:
- name: kube-proxy-port
port: 10249
protocol: TCP
targetPort: 10249
selector:
k8s-app: kube-proxy
type: ClusterIP
EOF
kubectl apply -f svc-kube-pxory.yaml
[root@master manifests]# kubectl -n kube-system get ep kube-proxy # There is a problem here, let's talk about it next
NAME ENDPOINTS AGE
kube-proxy 192.168.118.140:10249,192.168.118.141:10249,192.168.118.142:10249 109s
[root@master manifests]# kubectl -n kube-system get svc kube-proxy
NAME TYPE CLUSTER-IP EXTERNAL-IP PORT(S) AGE
kube-proxy ClusterIP 10.110.255.154 <none> 10249/TCP 112s
# To write a list of yaml resources, you can find a servicemonitor to modify it
cat > servicemonitor-kube-proxy.yaml <<'EOF'
apiVersion: monitoring.coreos.com/v1
kind: ServiceMonitor
metadata:
labels:
app.kubernetes.io/name: kube-proxy
app.kubernetes.io/part-of: kube-prometheus
name: kube-proxy
namespace: monitoring
spec:
endpoints:
- bearerTokenFile: /var/run/secrets/kubernetes.io/serviceaccount/token
interval: 30s
port: kube-proxy-port # This is consistent with the service port name
scheme: http
path: /metrics
jobLabel: app.kubernetes.io/name
namespaceSelector:
matchNames:
- kube-system
selector:
matchLabels:
app.kubernetes.io/name: kube-proxy
EOF
kubectl -n monitoring apply -f servicemonitor-kube-proxy.yaml
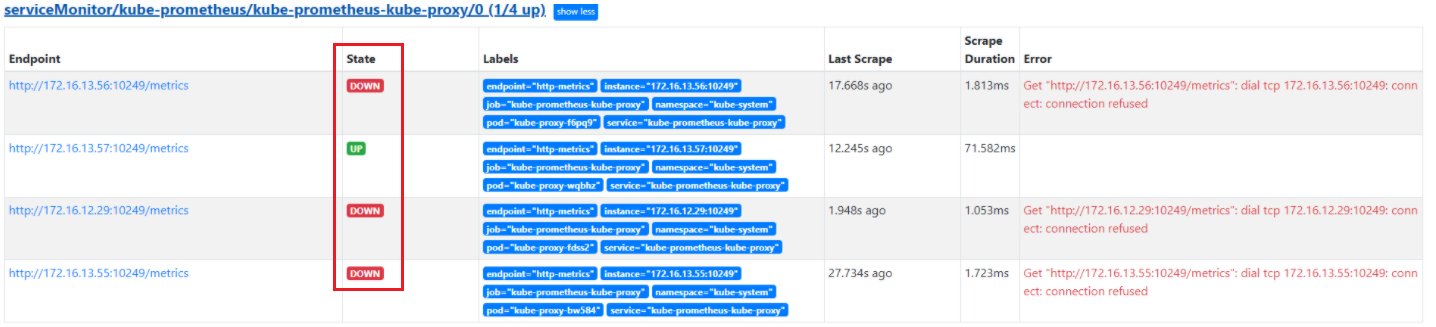
# After creation, the Prometheus page can already monitor kube-proxy.
#But there is a problem, an error was reported
Get "http://192.168.118.140:10249/metrics": dial tcp 192.168.118.140:10249: connect: connection refused
# We found that the IPs are all the IPs of the host. If you use this url to access the server, the access cannot be achieved. IP access using service is also inaccessible
#The reason is that kube-proxy listens to port 127.0.0.1. Although kube-proxy is deployed using demonset, network: true, and uses the host network.
#But kube-proxy listens to the host's 127.0.0.1 IP, and the corresponding IPs of the ep we created are also the host's IPs
#So, the question now is how to make the kube-proxy port monitor on the host network card, that is, let its port monitor on 0.0.0.0
[root@master manifests]# netstat -lntup| grep kube-proxy
tcp 0 0 127.0.0.1:10249 0.0.0.0:* LISTEN 4528/kube-proxy # Listen only at 127.0.0.1
tcp6 0 0 :::10256 :::* LISTEN 4528/kube-proxy
[root@master manifests]# kubectl -n kube-system get ep kube-proxy
NAME ENDPOINTS AGE
kube-proxy 192.168.118.140:10249,192.168.118.141:10249,192.168.118.142:10249 92m
[root@master manifests]#
# Modify the configuration file of kube-proxy
kubectl -n kube-system get cm kube-proxy -oyaml | grep -i address
bindAddress: 0.0.0.0 # Through query, we found that the default is to listen on 0.0.0.0, but we don't want to modify this
bindAddressHardFail: true
healthzBindAddress: ""
metricsBindAddress: "" # What we want to modify is this IP
nodePortAddresses: null
#Edit ConfigMap online
kubectl -n kube-system edit cm kube-proxy
metricsBindAddress: "0.0.0.0" # Mainly modify this to 0.0.0.0
#Restart pod
kubectl -n kube-system rollout restart ds kube-proxy
[root@master ~]# netstat -lntup | grep proxy # The port has been listened on 0.0.0.0
tcp6 0 0 :::10249 :::* LISTEN 111980/kube-proxy
tcp6 0 0 :::10256 :::* LISTEN 111980/kube-proxy
[root@master ~]#
# Now our curl kube-proxy service's IP and indicator interface are normal
# The curl service address is normal, then the IP address port of curl endpoints must be normal.
kubectl -n kube-system get svc kube-proxy
curl 10.110.255.154:10249/metrics
curl 192.168.118.140:10249/metrics
curl 192.168.118.141:10249/metrics
curl 192.168.118.142:10249/metrics
# Prometheus page is normal too
kube-prometheus monitoring nginx-ingress
nginx-ingressIt is the entrance to the k8s cluster traffic, it is very important, we need to monitor itnginx-ingress,default kube-prometheusThere is no monitoringnginx-ingress, and nginx-ingress itself exposes the data metric interface, so we need to create it ourselvesserviceMonitormonitornginx-ingress。
kubectl -n ingress-nginx get ds ingress-nginx-controller
kubectl -n ingress-nginx get pods
#By viewing yaml, you can know that the pod exposes the 10254 indicator port
kubectl get pods ingress-nginx-controller-g7vmn -n ingress-nginx -oyaml
#curl pod port 10254 has a lot of content exposed
curl 192.168.118.132:10254/metrics
# Create a service corresponding to ingress-nginx
#We found that there is already a service with corresponding tags, but this service does not define the port with targetPort as 10254.
[root@master ~]#  kubectl get svc -n ingress-nginx -l  app.kubernetes.io/name=ingress-nginx
NAME                                 TYPE        CLUSTER-IP      EXTERNAL-IP   PORT(S)   AGE
ingress-nginx-controller-admission   ClusterIP   10.102.72.255   <none>        443/TCP   245d
# Add the port where targetPort is 10254
[root@master ~]#  kubectl edit svc ingress-nginx-controller-admission -n ingress-nginx
  ports:
  - appProtocol: https
    name: https-webhook
    port: 443
    protocol: TCP
    targetPort: webhook
  - name: metrics			#Add this paragraph means that a 10245 port is defined on the service, corresponding to the 10245 port of the pod
    port: 10254
    protocol: TCP
    targetPort: 10254
# Verify that the metrics data metrics can be read through the service port 10254
curl  10.102.72.255:10254/metrics

#Now create servicemonitors to monitor nginx-ingress
#Create servicesmonitors for nginx-ingress
cat > servicemonitor-nginx-ingress.yaml <<'EOF'
apiVersion: monitoring.coreos.com/v1
kind: ServiceMonitor
metadata:
  labels:
    app.kubernetes.io/name: ingress-nginx
  name: ingress-nginx
  namespace: monitoring
spec:
  endpoints:
     - path: /metrics # Data metrics interface
         interval: 15s # Collection period
         port: metrics # This name should be consistent with the port name defined by the service
  jobLabel: app.kubernetes.io/name
     namespaceSelector: # namespace selector, indicating which namespace service to select
    matchNames:
    - ingress-nginx
     selector: # service selector, indicating the service to select the specified tag
    matchLabels:
      app.kubernetes.io/name: ingress-nginx
EOF
kubectl apply -f servicemonitor-nginx-ingress.yaml
After creating, we find targets on the prometheus page (http://192.168.118.131:32539/targets ) Nginx-ingress is still not displayed inside, checkprometheus-k8s-0This pod saw an error:
# Check prometheus-k8s-0 pod. I saw an error, and the forbidden permission is insufficient.
[root@master servicemonitor-nginx-ingress]# kubectl logs -n monitoring  prometheus-k8s-0 -c prometheus
ts=2022-10-21T04:57:14.829Z caller=klog.go:116 level=error component=k8s_client_runtime func=ErrorDepth msg="pkg/mod/k8s.io/[email protected]/tools/cache/reflector.go:167: Failed to watch *v1.Service: failed to list *v1.Service: services is forbidden: User \"system:serviceaccount:monitoring:prometheus-k8s\" cannot list resource \"services\" in API group \"\" in the namespace \"ingress-nginx\""

# View the cluster roles created by prometheus
[root@master ~]# kubectl get clusterroles prometheus-k8s -oyaml
apiVersion: rbac.authorization.k8s.io/v1
........
rules:						#The default permissions are too few
- apiGroups:
  - ""
  resources:
  - nodes/metrics
  verbs:
  - get
- nonResourceURLs:
  - /metrics
  verbs:
  - get

# Modify permissions of cluster roles
[root@master ~]# kubectl edit clusterroles prometheus-k8s
rules:						#Add permissions
  - apiGroups:
      - ""
    resources:
      - nodes
      - services
      - endpoints
      - pods
      - nodes/proxy
    verbs:
      - get
      - list
      - watch
  - apiGroups:
      - ""
    resources:
      - configmaps
      - nodes/metrics
    verbs:
      - get
  - nonResourceURLs:
      - /metrics
    verbs:
      - get
Here we found the targets on the prometheus page (http://192.168.118.131:32539/targets ) There is a nginx-ingress displayed, which means that it has been monitored.
kube-prometheus monitors redis master and slave
# If there is a redis master-slave replication cluster in the namespace, we need to use kube-prometheus to monitor the redis master-slave replication cluster
[root@dev-master ~]# kubectl  -n ruoyi  get po -l app.kubernetes.io/instance=redis
NAME               READY   STATUS    RESTARTS   AGE
redis-master-0     1/1     Running   1          78d
redis-replicas-0   1/1     Running   2          78d
redis-replicas-1   1/1     Running   1          7d
redis-replicas-2   1/1     Running   1          78d
[root@dev-master ~]# kubectl  -n ruoyi  get svc -l app.kubernetes.io/name=redis
NAME             TYPE        CLUSTER-IP      EXTERNAL-IP   PORT(S)    AGE
redis-headless   ClusterIP   None            <none>        6379/TCP   106d
redis-master     ClusterIP   10.109.12.23    <none>        6379/TCP   106d
redis-replicas   ClusterIP   10.109.78.217   <none>        6379/TCP   106d

# Use helm to install redis-exporter
helm repo add kubegemsapp https://charts.kubegems.io/kubegemsapp
helm repo update
helm pull  kubegemsapp/prometheus-redis-exporter --version=4.7.4
tar xf prometheus-redis-exporter-4.7.4.tgz
cd prometheus-redis-exporter/
# Modify values.yaml file
vim values.yaml
[root@dev-master prometheus-redis-exporter]# grep -Ev '#|$^' values.yaml
rbac:
  create: false
  pspEnabled: false
serviceAccount:
  create: false
  name:
replicaCount: 1
image:
  repository: registry.cn-beijing.aliyuncs.com/kubegemsapp/redis_exporter
  tag: v1.27.0
  pullPolicy: IfNotPresent
nameOverride: redis-exporter
fullnameOverride: redis-exporter
extraArgs: {}
customLabels: {}
securityContext: {}
env: {}
service:
  type: ClusterIP
  port: 9121
  annotations: {}
  labels: {}
resources:
  limits:
    cpu: 100m
    memory: 128Mi
  requests:
    cpu: 20m
    memory: 64Mi
nodeSelector: {}
tolerations: []
affinity: {}
redisAddress: redis://redis-master.ruoyi.svc:6379		# Specify the namespace of redis, where the service of redis-master is specified
annotations: {}
labels: {}
redisAddressConfig:
  enabled: false
  configmap:
    name: ""
    key: ""
serviceMonitor:
  enabled: true
  interval: 60s
  telemetryPath: /metrics
  timeout: 10s
  additionalLabels: {}
alerts:
  enabled: true
auth:
  enabled: true
  secret:
    name: "redis"			# Set the secret name of redis here
    key: "redis-password"	#redis's secret key name
  redisPassword: "password"
[root@dev-master prometheus-redis-exporter]#
# We set the redis secret above. Since it is in the ruoyi namespace, it needs to be added
kubectl  -n ruoyi  get secrets  redis -oyaml > redis-secrets.yaml
vim redis-secrets.yaml	# Modify the namespace to monitor
kubectl  -n monitoring create  -f redis-secrets.yaml

# Deploy redis-exporter, where all resources are placed in the monitoring namespace for easy management, and of course it can also be placed in any namespace
helm -n monitoring  template redis-exporter ./
helm -n monitoring  install  redis-exporter ./
kubectl  -n monitoring  get po  redis-exporter-75ccfb99cf-v4644  -owide
kubectl  -n monitoring  logs  redis-exporter-75ccfb99cf-v4644
# Use the curl command to view the pod ID's metrics directly
curl 10.244.0.83:9121/metrics
# Finally, you have seen the redis-exporter in the targets bar in the prometheus server, and then import the template in grafana.

# So, we are very curious, so we can deploy the redis-exporter pod to collect redis indicators. Didn’t we say that we wanted to create servicemonitors when collecting k8s components before
# If you observe carefully, you will find that in fact, we have deployed many Prometheus resources during installation, such as ServiceMonitor and PrometheusRule
helm -n monitoring  template redis-exporter ./

#In the past, our k8s component exposed the metrics interface by default, but our own applications, such as some middleware redis, mysql, etc., need to use the exporter to expose the metrics interface.
# Process for collecting k8s component data indicators
prometuhs -> servicemonitor -> service -> enpoints -> kube-peoxy pod(The indicator interface is exposed)
# Collection of middleware data indicator process
prometuhs -> servicemonitor -> service -> enpoints -> redis-exporter(Deploy a redis-exporter exposes redis metric interface) ->redis pod

[root@master ~]# kubectl -n monitoring get po redis-exporter-75ccfb99cf-rgtrx -owide
NAME                              READY   STATUS    RESTARTS   AGE   IP            NODE
redis-exporter-75ccfb99cf-rgtrx   1/1     Running   0          12m   10.244.1.65   node2
# Servicemonitors were created automatically
[root@master ~]# kubectl -n monitoring get  servicemonitors.monitoring.coreos.com redis-exporter
NAME             AGE
redis-exporter   13m
[root@master ~]# kubectl -n monitoring get  service redis-exporter
NAME             TYPE        CLUSTER-IP      EXTERNAL-IP   PORT(S)    AGE
redis-exporter   ClusterIP   10.107.26.231   <none>        9121/TCP   13m
[root@master ~]# kubectl -n monitoring get  ep redis-exporter
NAME             ENDPOINTS          AGE
redis-exporter   10.244.1.65:9121   13m

# You can see that the overall workflow is like this
 The servicemonitor is associated with a service, and the service is associated with enpoints. The backend pod IP and port corresponding to the endpoint are the IP and port of the redis-exporter pod. The redis-exporter itself collects redis data indicators. Its yaml defines the address of the redis to be collected. That's it.
Manually access the metrics interface of the k8s component
We manually access the metrics interface of the k8s component.
[root@master setup]# curl -k https://192.168.118.140:10259/metrics
{
  "kind": "Status",
  "apiVersion": "v1",
  "metadata": {

  },
  "status": "Failure",
  "message": "forbidden: User \"system:anonymous\" cannot get path \"/metrics\"",
  "reason": "Forbidden",
  "details": {

  },
  "code": 403
}[root@master setup]#
# By default, authentication access is required
# So how to authenticate?
#In k8s, authentication and access can be performed through certificates or tokens.
#So, where does this token come from?
#It involves a concept. The concept in k8s is the issue of permissions, such as the concepts of clusterrole and serviceaccount.
#serviceaccount is the concept of a user in k8s. As long as the serviceaccount has permission to access node resources, you can obtain information about the corresponding resource.

# You can get tokens from sa created by prometheus
kubectl -n monitoring  get sa prometheus-k8s -oyaml
kubectl  -n monitoring  get secrets  prometheus-k8s-token-27mlq -oyaml
[root@master ~]# kubectl  -n monitoring  get secrets  prometheus-k8s-token-27mlq -oyaml
apiVersion: v1
data:
 .......
  token: ZXlKaGJHY2lPaUpTVXp...................pZdmlkOUpVRFhWSkVB
kind: Secret

# token is encrypted and needs to be decrypted
echo "ZXlKaGJHY2lPaUpTVXp....................pZdmlkOUpVRFhWSkVB" | base64 -d
# Define a token variable, the value is the decrypted content
export token=Decrypted characters

# When accessing metrics, it will be normal
curl -s -k -H "Authorization: Bearer $token" https://192.168.118.140:10259/metrics


# This is OK, note that tr -d deliberately changed a line, indicating that the string content needs to be removed from the newline characters, and you can copy and paste it directly to execute.
token=$(kubectl  -n monitoring  get secrets  prometheus-k8s-token-27mlq -oyaml | grep 'token:' | awk '{print $2}' | tr -d '
' | base64 -d )
curl -s -k -H "Authorization: Bearer $token" https://192.168.118.140:10259/metrics
Prometheus configuration file
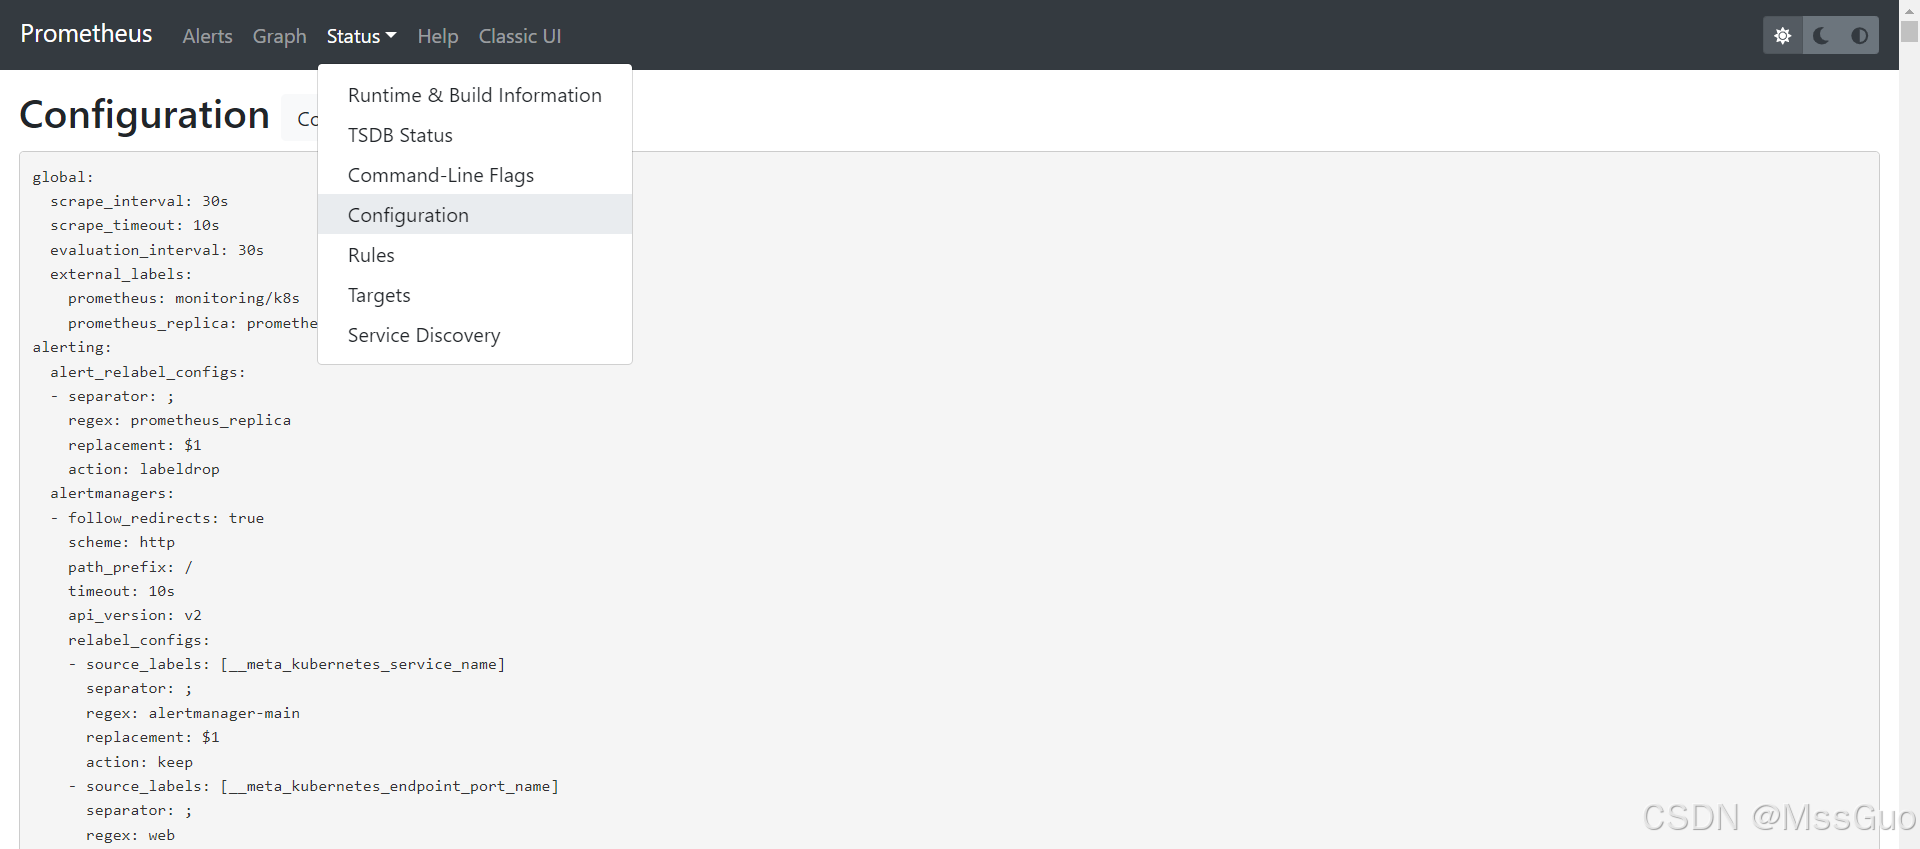
The configuration file name of the prometheus deployed in binary was prometheus.yaml. Now we use the prometheus deployed in kube-prometheus. We can also see its configuration file on the page:
# View sts
kubectl   -n  monitoring  get sts prometheus-k8s  -oyaml > prometheus-k8s.yaml
# We'll streamline some important information
vim prometheus-k8s.yaml
  serviceName: prometheus-operated
  template:
    metadata:
    spec:
      containers:
      - args:
        - --web.console.templates=/etc/prometheus/consoles
        - --web.console.libraries=/etc/prometheus/console_libraries
        - --config.file=/etc/prometheus/config_out/prometheus.env.yaml
        - --storage.tsdb.path=/prometheus
        - --storage.tsdb.retention.time=15d
        - --web.enable-lifecycle
        - --web.route-prefix=/
        - --web.config.file=/etc/prometheus/web_config/web-config.yaml
        image: quay.io/prometheus/prometheus:v2.32.1
        name: prometheus		# This is the main container
        ports:
        - containerPort: 9090	#Main container port 9090
          name: web
        volumeMounts:
        - mountPath: /etc/prometheus/config_out
          name: config-out
          readOnly: true
        - mountPath: /etc/prometheus/certs
          name: tls-assets
          readOnly: true
        - mountPath: /prometheus	# Database mount point, pvc storage
          name: prometheus-k8s-db
          subPath: prometheus-db
        - mountPath: /etc/prometheus/rules/prometheus-k8s-rulefiles-0
          name: prometheus-k8s-rulefiles-0
        - mountPath: /etc/prometheus/web_config/web-config.yaml
          name: web-config
          readOnly: true
          subPath: web-config.yaml
      - args:
        - --listen-address=:8080		# Port of sidecar container
        - --reload-url=http://localhost:9090/-/reload
        - --config-file=/etc/prometheus/config/prometheus.yaml.gz	# This is Prometheus' main configuration file
        - --config-envsubst-file=/etc/prometheus/config_out/prometheus.env.yaml
        - --watched-dir=/etc/prometheus/rules/prometheus-k8s-rulefiles-0
        command:
        - /bin/prometheus-config-reloader
        env:
        - name: POD_NAME
          valueFrom:
            fieldRef:
              apiVersion: v1
              fieldPath: metadata.name
        - name: SHARD
          value: "0"
        image: quay.io/prometheus-operator/prometheus-config-reloader:v0.53.1
        name: config-reloader		# This is a sidecar container with dynamic loading of configuration files
        ports:
        - containerPort: 8080
          name: reloader-web
        volumeMounts:
        - mountPath: /etc/prometheus/config
          name: config
        - mountPath: /etc/prometheus/config_out
          name: config-out
        - mountPath: /etc/prometheus/rules/prometheus-k8s-rulefiles-0
          name: prometheus-k8s-rulefiles-0
      initContainers:
      - args:
        - --watch-interval=0
        - --listen-address=:8080
        - --config-file=/etc/prometheus/config/prometheus.yaml.gz
        - --config-envsubst-file=/etc/prometheus/config_out/prometheus.env.yaml
        - --watched-dir=/etc/prometheus/rules/prometheus-k8s-rulefiles-0
        command:
        - /bin/prometheus-config-reloader
        env:
        - name: POD_NAME
          valueFrom:
            fieldRef:
              apiVersion: v1
              fieldPath: metadata.name
        - name: SHARD
          value: "0"
        image: quay.io/prometheus-operator/prometheus-config-reloader:v0.53.1
        imagePullPolicy: IfNotPresent
        name: init-config-reloader
        ports:
        - containerPort: 8080
          name: reloader-web
          protocol: TCP
        volumeMounts:
        - mountPath: /etc/prometheus/config
          name: config
        - mountPath: /etc/prometheus/config_out
          name: config-out
        - mountPath: /etc/prometheus/rules/prometheus-k8s-rulefiles-0
          name: prometheus-k8s-rulefiles-0
      volumes:
      - name: config
        secret:
          defaultMode: 420
          secretName: prometheus-k8s	#Prometheus's main configuration file
      - name: tls-assets
        projected:
          defaultMode: 420
          sources:
          - secret:
              name: prometheus-k8s-tls-assets-0
      - emptyDir: {}
        name: config-out
      - configMap:
          defaultMode: 420
          name: prometheus-k8s-rulefiles-0
        name: prometheus-k8s-rulefiles-0
      - name: web-config
        secret:
          defaultMode: 420
          secretName: prometheus-k8s-web-config
# From the above yaml file, we can see that the Prometheus main container does not use the configuration file directly, but uses a sidecar container with config-reloader to dynamically load the configuration file.
# And the configuration files are mounted using secret volumes
# We checked the prometheus-k8s secret volume and found that this is a compressed file or encrypted, and we can't see anything
[root@master setup]# kubectl  -n monitoring  get secrets   prometheus-k8s -oyaml
apiVersion: v1
data:
  prometheus.yaml.gz: H4sIAAAAAA.....sAAA==
kind: Secret
metadata:
  name: prometheus-k8s
  namespace: monitoring
......
type: Opaque
[root@master setup]#
# Let's go into the side car container to check
[root@master setup]# kubectl  -n monitoring  exec -it prometheus-k8s-0  -c config-reloader -- sh
/ $ cd /etc/prometheus/config
/etc/prometheus/config $ ls -lrth
total 0
lrwxrwxrwx    1 root     2000          25 Sep 27 04:33 prometheus.yaml.gz -> ..data/prometheus.yaml.gz
/etc/prometheus/config $ cd ..data/
/etc/prometheus/config/..2024_09_27_04_33_35.075698414 $ ls -lrth
total 4K
-rw-r--r--    1 root     2000        3.1K Sep 27 04:33 prometheus.yaml.gz
/etc/prometheus/config/..2024_09_27_04_33_35.075698414 $ pwd
/etc/prometheus/config/..data
[root@master setup]# Let's copy the file and take a look
kubectl  -n monitoring  cp  prometheus-k8s-0:/etc/prometheus/config/..2024_09_27_04_33_35.075698414/prometheus.yaml.gz -c  config-reloader   ./prometheus.yaml.gz
[root@master setup]# ll # Found this is a gz file
-rw-r--r-- 1 root root   3205 Sep 27 13:04 prometheus.yaml.gz
[root@master setup]# Unzip gz file
[root@master setup]# gunzip prometheus.yaml.gz # After decompression, the source file is deleted by default and the prometheus.yaml file is obtained.
[root@master setup]# vim prometheus.yaml # This question is Prometheus' configuration file, which is the configuration file content we see on the page
Learn about Prometheus' service discoveries
Let's review, the configuration file of binary Prometheus was previously deployed on Linux:
refer to:https://blog.csdn.net/MssGuo/article/details/122402074
cd /usr/local/prometheus-2.5.0.linux-amd64
#Edit the main configuration file and add a client configuration
vim prometheus.yml
# my global config
global:
  scrape_interval:     15s # Set the scrape interval to every 15 seconds. Default is every 1 minute.
  evaluation_interval: 15s # Evaluate rules every 15 seconds. The default is every 1 minute.
  # scrape_timeout is set to the global default (10s).

# Alertmanager configuration
alerting:
  alertmanagers:
  - static_configs:
    - targets:
      # - alertmanager:9093

# Load rules once and periodically evaluate them according to the global 'evaluation_interval'.
rule_files:
  # - "first_rules.yml"
  # - "second_rules.yml"

# A scrape configuration containing exactly one endpoint to scrape:
# Here it's Prometheus itself.
scrape_configs:
  # The job name is added as a label `job=<job_name>` to any timeseries scraped from this config.
  - job_name: 'prometheus'

    # metrics_path defaults to '/metrics'
    # scheme defaults to 'http'.

    static_configs:
    - targets: ['localhost:9090']


  - job_name: 'client1'									#Copy a job_name tag and compare it with the job_name above. Client1 is job_name, which can be customized
    static_configs:
    - targets: ['192.168.118.135:9100']					#Fill in the client's IP and node_export ports

#Note: Prometheus configuration file requires very strict syntax in yml format, yml syntax label alignment, spaces, etc.

#Close the prometheus service
kill -9 34937
#Restart the prometheus service
./prometheus &
We look at Prometheus' configuration file, which defines many service discoveries:
vim prometheus.yaml
global:
  scrape_interval: 30s
  scrape_timeout: 10s
  evaluation_interval: 30s
  external_labels:
    prometheus: monitoring/k8s
    prometheus_replica: prometheus-k8s-1
scrape_configs:
- job_name: serviceMonitor/monitoring/coredns/0		# Only view this job, a job is actually a monitoring item
  honor_timestamps: true
  scrape_interval: 15s		# Collection time, collect once every 15 seconds
  scrape_timeout: 10s		# Collection timeout time
  metrics_path: /metrics	# Data acquisition indicator interface
  scheme: http				# http architecture
  authorization:			#Certification
    type: Bearer			# Authentication type, here means that Prometheus pod uses token to connect to api-server
    credentials_file: /var/run/secrets/kubernetes.io/serviceaccount/token
  follow_redirects: true
  relabel_configs:
  - source_labels: [job]
    separator: ;
    regex: (.*)
    target_label: __tmp_prometheus_job_name
    replacement: $1
    action: replace
  - source_labels: [__meta_kubernetes_service_label_k8s_app, __meta_kubernetes_service_labelpresent_k8s_app]
    separator: ;
    regex: (kube-dns);true
    replacement: $1
    action: keep
  - source_labels: [__meta_kubernetes_endpoint_port_name]
    separator: ;
    regex: metrics
    replacement: $1
    action: keep
  - source_labels: [__meta_kubernetes_endpoint_address_target_kind, __meta_kubernetes_endpoint_address_target_name]
    separator: ;
    regex: Node;(.*)
    target_label: node
    replacement: ${1}
    action: replace
  - source_labels: [__meta_kubernetes_endpoint_address_target_kind, __meta_kubernetes_endpoint_address_target_name]
    separator: ;
    regex: Pod;(.*)
    target_label: pod
    replacement: ${1}
    action: replace
  - source_labels: [__meta_kubernetes_namespace]
    separator: ;
    regex: (.*)
    target_label: namespace
    replacement: $1
    action: replace
  - source_labels: [__meta_kubernetes_service_name]
    separator: ;
    regex: (.*)
    target_label: service
    replacement: $1
    action: replace
  - source_labels: [__meta_kubernetes_pod_name]
    separator: ;
    regex: (.*)
    target_label: pod
    replacement: $1
    action: replace
  - source_labels: [__meta_kubernetes_pod_container_name]
    separator: ;
    regex: (.*)
    target_label: container
    replacement: $1
    action: replace
  - source_labels: [__meta_kubernetes_service_name]
    separator: ;
    regex: (.*)
    target_label: job
    replacement: ${1}
    action: replace
  - source_labels: [__meta_kubernetes_service_label_app_kubernetes_io_name]
    separator: ;
    regex: (.+)
    target_label: job
    replacement: ${1}
    action: replace
  - separator: ;
    regex: (.*)
    target_label: endpoint
    replacement: metrics
    action: replace
  - source_labels: [__address__]
    separator: ;
    regex: (.*)
    modulus: 1
    target_label: __tmp_hash
    replacement: $1
    action: hashmod
  - source_labels: [__tmp_hash]
    separator: ;
    regex: "0"
    replacement: $1
    action: keep
  metric_relabel_configs:
  - source_labels: [__name__]
    separator: ;
    regex: coredns_cache_misses_total
    replacement: $1
    action: drop
  kubernetes_sd_configs:
  - role: endpoints
    kubeconfig_file: ""
    follow_redirects: true
    namespaces:
      names:
      - kube-system
So, who defined the Prometheus configuration file? We created an ingress-nginx before and did not modify the Prometheus configuration file? Ingress-nginx can also be normal.
It turns out that after you create a servicemonitors (servicemonitors associated service, service related pod), Prometheus will automatically modify the value of prometheus.yaml.gz of secrets prometheus-k8s, and then the sidecar container will automatically load and take effect. Therefore, we only need to be familiar with the definition of servicemonitors. There is no need to manually edit the Prometheus configuration file. No wonder the official made the Prometheus configuration file into a secrets resource. It turns out that it is.
This article explains Prometheus' service discovery. It is well written. You can read it:Prometheus Learning Notes Service Discovery kubernetes_sd_configs https://blog.51cto.com/u_8901540/12118325
Alarm rules
You can find the alarm rules from this open source github project:
https://github.com/samber/awesome-prometheus-alerts
# This warehouse also has many warning rules
https://github.com/helm/charts/tree/master/stable/prometheus-operator/templates/prometheus/rules
# You can see that there are many alarm rule files in the side car container
[root@master setup]# kubectl  -n monitoring  exec -it prometheus-k8s-0  -c config-reloader -- sh
/ $ cd /etc/prometheus/rules/prometheus-k8s-rulefiles-0/
/etc/prometheus/rules/prometheus-k8s-rulefiles-0 $ ls
monitoring-alertmanager-main-rules-7050ad08-a18a-4df9-b0bb-835da9b99a20.yaml          monitoring-node-exporter-rules-079bdb01-7159-46e6-92a4-691f30f64270.yaml
monitoring-kube-prometheus-rules-d40b5d99-a8d7-4dac-9e3d-95bd994d5949.yaml            monitoring-prometheus-k8s-prometheus-rules-8a93e113-1d43-43fb-9019-af265730d88e.yaml
monitoring-kube-state-metrics-rules-c276ee95-abef-4cef-a8a7-c818c60196d7.yaml         monitoring-prometheus-operator-rules-f8bf3204-3489-4c06-bf5b-0982f650e8c4.yaml
monitoring-kubernetes-monitoring-rules-67cf70c7-985f-4037-bd22-690bbcc5d6c1.yaml
/etc/prometheus/rules/prometheus-k8s-rulefiles-0 $ ls -lrth
total 0
lrwxrwxrwx    1 root     2000          85 Sep 23 09:29 monitoring-prometheus-operator-rules-f8bf3204-3489-4c06-bf5b-0982f650e8c4.yaml -> ..data/monitoring-prometheus-operator-rules-f8bf3204-3489-4c06-bf5b-0982f650e8c4.yaml
lrwxrwxrwx    1 root     2000          91 Sep 23 09:29 monitoring-prometheus-k8s-prometheus-rules-8a93e113-1d43-43fb-9019-af265730d88e.yaml -> ..data/monitoring-prometheus-k8s-prometheus-rules-8a93e113-1d43-43fb-9019-af265730d88e.yaml
lrwxrwxrwx    1 root     2000          79 Sep 23 09:29 monitoring-node-exporter-rules-079bdb01-7159-46e6-92a4-691f30f64270.yaml -> ..data/monitoring-node-exporter-rules-079bdb01-7159-46e6-92a4-691f30f64270.yaml
lrwxrwxrwx    1 root     2000          87 Sep 23 09:29 monitoring-kubernetes-monitoring-rules-67cf70c7-985f-4037-bd22-690bbcc5d6c1.yaml -> ..data/monitoring-kubernetes-monitoring-rules-67cf70c7-985f-4037-bd22-690bbcc5d6c1.yaml
lrwxrwxrwx    1 root     2000          84 Sep 23 09:29 monitoring-kube-state-metrics-rules-c276ee95-abef-4cef-a8a7-c818c60196d7.yaml -> ..data/monitoring-kube-state-metrics-rules-c276ee95-abef-4cef-a8a7-c818c60196d7.yaml
lrwxrwxrwx    1 root     2000          81 Sep 23 09:29 monitoring-kube-prometheus-rules-d40b5d99-a8d7-4dac-9e3d-95bd994d5949.yaml -> ..data/monitoring-kube-prometheus-rules-d40b5d99-a8d7-4dac-9e3d-95bd994d5949.yaml
lrwxrwxrwx    1 root     2000          83 Sep 23 09:29 monitoring-alertmanager-main-rules-7050ad08-a18a-4df9-b0bb-835da9b99a20.yaml -> ..data/monitoring-alertmanager-main-rules-7050ad08-a18a-4df9-b0bb-835da9b99a20.yaml

# By viewing the yaml definition of sts, we learned that the alarm rule file is mounted through configmap
kubectl  -n monitoring  get  sts prometheus-k8s -oyaml
kubectl  -n monitoring  get cm prometheus-k8s-rulefiles-0 -oyaml	# Alarm rule files are defined here
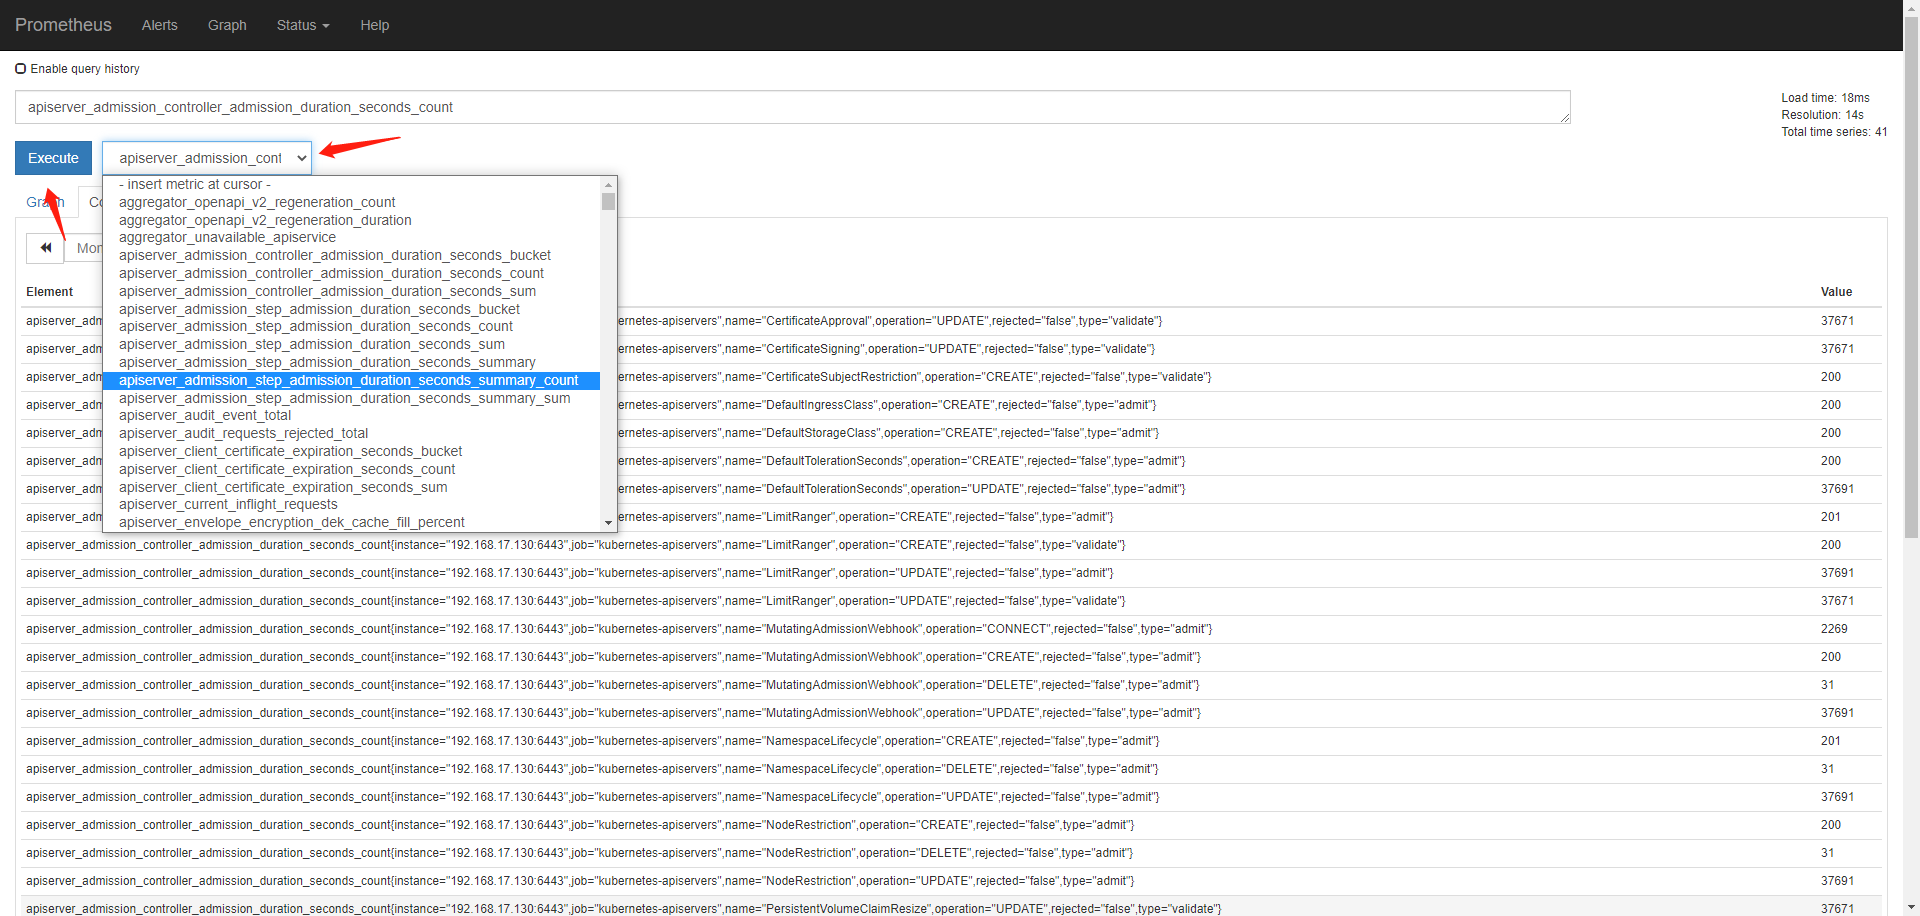
Alarm is actually writing an expression, getting the value of a certain indicator, and then calculating it. If it is greater than or less than a certain value, it will be called. For example, if the value of the memory indicator is greater than 80% of the total memory, it will be called: there is insufficient available memory. Wait, that's how the alarm is. Therefore, this indicator must be guaranteed. Go to the Prometheus page and enter the metric name to see if there is any metric.
Comparison of Prometheus and kube-promethus in binary deployment
Prometheus deployed in the traditional way defines the target host to crawl metrics in the prometheus.yaml configuration file. This is how to configure targets statically, as follows:
scrape_configs:
  - job_name: 'prometheus'				# Define a job name, which can be customized, and each target host to be crawled defines a job
    static_configs:						# This means static configuration, and there is another type called service discovery, which will be discussed below
      - targets: ['localhost:9090'] 	#The target host IP port to be crawled
        metrics_path: /metrics			# Data metrics interface, metrics_path defaults to '/metrics'
  - job_name: 'node-exporter'
    static_configs:						# This means static configuration
      - targets: ['192.168.118.112:9100'] 	#The target host IP port to be crawled
        metrics_path: /metrics			# Data metrics interface, metrics_path defaults to '/metrics'
And kube-promethus is configured using the service discovery mechanism:
scrape_configs:
- job_name: serviceMonitor/default/redis-exporter/0
  honor_timestamps: true
  scrape_interval: 1m
  scrape_timeout: 10s
  metrics_path: /metrics
  scheme: http
  follow_redirects: true
  relabel_configs:
  - source_labels: [__tmp_hash]
    separator: ;
    regex: "0"
    replacement: $1
    action: keep
  kubernetes_sd_configs:
  - role: endpoints
    kubeconfig_file: ""
    follow_redirects: true
    namespaces:
      names:
      - default
This is because in the k8s cluster, all configurations exist in the form of resource objects, that is, CRD resources. Prometheus deployed in our traditional way needs to define the target host targets, alarm rules, etc. to be captured in promethus.yaml. In kube-promethus, the official abstracts the configuration through CRD resource servicemonitors and prometheusrules. When you create a servicemonitors, promethus will automatically convert it to the target host configuration in promethus.yaml. So now you only need to know how to write servicemonitors as follows. The same is true for the alarm rules. Promethus will automatically convert it to the alarm rules in promethus.yaml.
This is just like the nginx-ingress we are familiar with. We only need to create ingress. The nginx-ingress-controller will automatically load the rules defined in ingress into nginx.confg and take effect. k8s is powerful, this is the concept that k8s configuration is all resource objects.
If Prometheus is deployed outside the k8s cluster, how do you monitor the k8s cluster?
Deploy a kube-state-metrics deployment in the k8s cluster. kube-state-metrics exposes the data metrics of the k8s cluster, and then creates a NodePort service. The Prometheus service configuration file can directly configure this IP port to capture the data metrics.
Intelligent Recommendation
HELM deploys Bitnami/Kube-ProMetHeus monitoring in K8S
K8S deployment Bitnami/Kube-Proometheus Most of the mirror images of Kube-Prometheus-Stack are abroad. Linux has no VPN download failure. Here, combined with SC storage, Helm, Kube-PROMETHEUS, and cus...
K8S deployment kube-state-metrics
K8S deployment kube-state-metrics 1. Need YAML file 1.1 kube-state-metrics-rbac.yaml 1.2 kube-state-metrics-service.yaml 1.3 kube-state-metrics-deployment.yaml 2. Deploy 3. Install the Kube-State-Metr...
K8S deployment Prometheus with Node-Exporter, Kube-State-Metrics, Metrics-Server monitoring of host and K8S monitoring using Grafana display
The origin of things comes from a certain Mr. Monitoring, which is slightly recorded here, and the mirror used is from Bitnami. Bitnami is an open sourceprojectThe open source software generated by th...
k8s deployment prometheus
https://www.kancloud.cn/huyipow/prometheus/527092 https://songjiayang.gitbooks.io/prometheus/content/demo/target.html Creating monitoring namespaces Prometheus RBAC Rights Management Cre...

Deployment of Prometheus in K8s
1. Create a Namespace, SA account, operate in the K8S cluster's Master node # Create a namespace of Monitor-SA # Create a SA account # Bind the SA Account Monitor through ClusterRoleBing to Clusterrol...
More Recommendation
Prometheus + grafana on k8s deployment
One-button deployment linkClick me to jump Deploy Prometheus + Grafana to monitor POD and Node node information using K8S mode Environmental foundation: K8s cluster Create a namespace for easy managem...
Install deployment in Prometheus-K8s
Fourth, installation in K8S PrometheusThere are many installation methods, such as: GitEe: https://gitee.com/liugpwwwroot/k8s-prometheus-grafana/tree/master/prometheus; GItHub: https://githu...
Prometheus Monitor Kube-State-Metrics in K8S Cluster Series
Foreword As we introduced by CADvisor and Node-Exporter to monitor K8S cluster containers and host resources today, we will introduce you to Kube-State-Metrics's monitoring of K8S clusters. What is it...
K8S entry: Kube-Proometheus-Stack Family Barrel Building (Grafana + Prometheus)
Series articles Chapter 1: K8S entry: bare metal deployment K8S cluster Chapter 2: :K8S entry: deployment and application to the K8S cluster Chapter 3: :K8S entry: simple use of service Chapter 4: :K8...
centos7 based k8s installation and deployment prometheus (Prometheus)
Installation and deployment prometheus (Prometheus) under k8s environment Preparing the Environment 1, installation and deployment environment git 2, installation and deployment k8s Click Jump 3, mirr...