Arduino serial data visualization method
System: win10 64bits
Arduino IDE: 1.8.5
Arduino development board: UNO
Arduino can easily operate the sensor to obtain sensor data. After getting the data, we are more concerned about data visualization. Arduino comes with a serial monitor and serial plotter. I also found 3 other tools suitable for Arduino serial data plotting. This article The blog is also used as a record to introduce these four drawing methods. The sensor data is the temperature collected by the K-type thermocouple introduced in the previous blog.
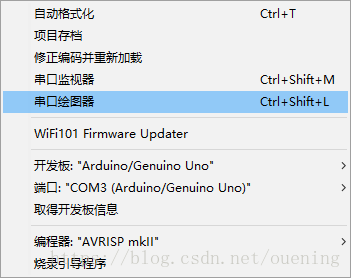
(1) Serial port plotter that comes with IDE
Procedure 1
#include <MAX6675_Thermocouple.h>
#define SCK_PIN 3 // The SCK port on the module is connected to pin3
#define CS_PIN 4 // The CS port on the module is connected to pin4
#define SO_PIN 5 // The SO port on the module is connected to pin5
// Don't forget that the 5v and GND on the module should be connected to the arduino development board
MAX6675_Thermocouple* thermocouple = NULL;
// the setup function runs once when you press reset or power the board
void setup() {
Serial.begin(9600); //Set the serial port baud rate to 9600
thermocouple = new MAX6675_Thermocouple(SCK_PIN, CS_PIN, SO_PIN);
}
// the loop function runs over and over again forever
void loop() {
double celsius = thermocouple->readCelsius(); // degrees Celsius
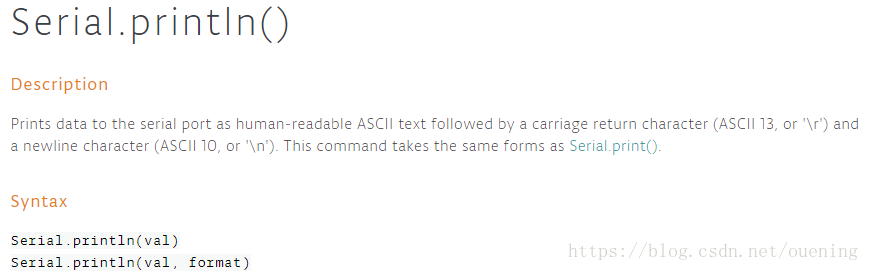
Serial.println(celsius); // println printing will automatically add'\r\n', which can be displayed in the serial plotter
delay(500);// Delay 500ms
}
After the program is executed, just open it. Note that the serial port output in the program should be usedSerial.println , The official introduction of this function is as follows
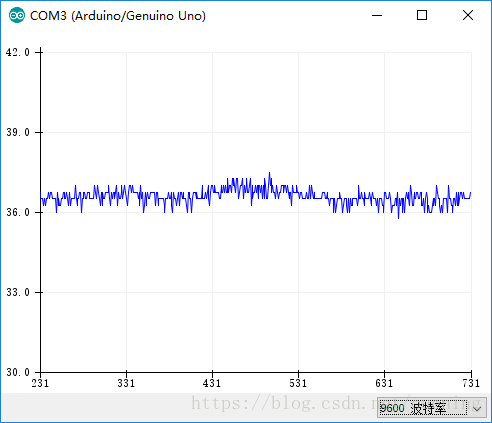
The drawing shown by the final plotter is as follows
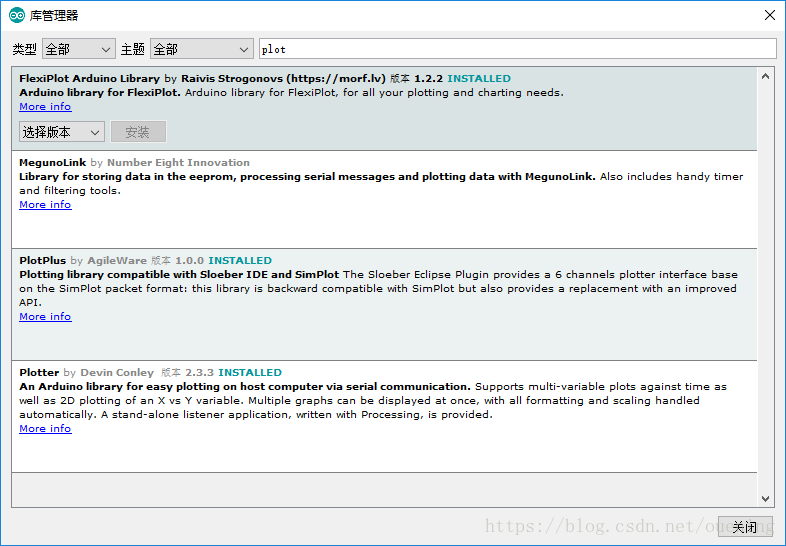
The following three drawing tools can be selected from the toolbar on the IDE [Project]-[Load Library]-[Manage Library], and then search and install
(2)Plotter
Project address:https://github.com/devinaconley/arduino-plotter
Additional drawing tools required:Listener Find the software in the link, select the corresponding version according to your system, note that this requires a JRE environment, JRE download address:
http://www.oracle.com/technetwork/java/javase/downloads/jre8-downloads-2133155.html
Procedure 2
#include <MAX6675_Thermocouple.h>
#include "Plotter.h"
double x;
Plotter p;

#define SCK_PIN 3 // The SCK port on the module is connected to pin3
#define CS_PIN 4 // Connect the CS port on the module to pin4
#define SO_PIN 5 // Connect the SO port on the module to pin5
// Don't forget that the 5v and GND on the module should be connected to the arduino development board

MAX6675_Thermocouple* thermocouple = NULL;

// the setup function runs once when you press reset or power the board
void setup() {
  p.Begin();  // Create a plotter
  p.AddTimeGraph( "Temperature of K-type thermalcouple", 100, "temperature", x ); // Add time chart
  // No need to set the baud rate
  thermocouple = new MAX6675_Thermocouple(SCK_PIN, CS_PIN, SO_PIN);
}

// the loop function runs over and over again forever
void loop() {
  double celsius = thermocouple->readCelsius(); // degrees Celsius
  x = celsius;
  p.Plot();
// Serial.println(celsius); // println printing will automatically add'\r\n', which can be displayed on the serial plotter
  delay(500);// Delay 500ms
}
Open the listener and get the result as follows
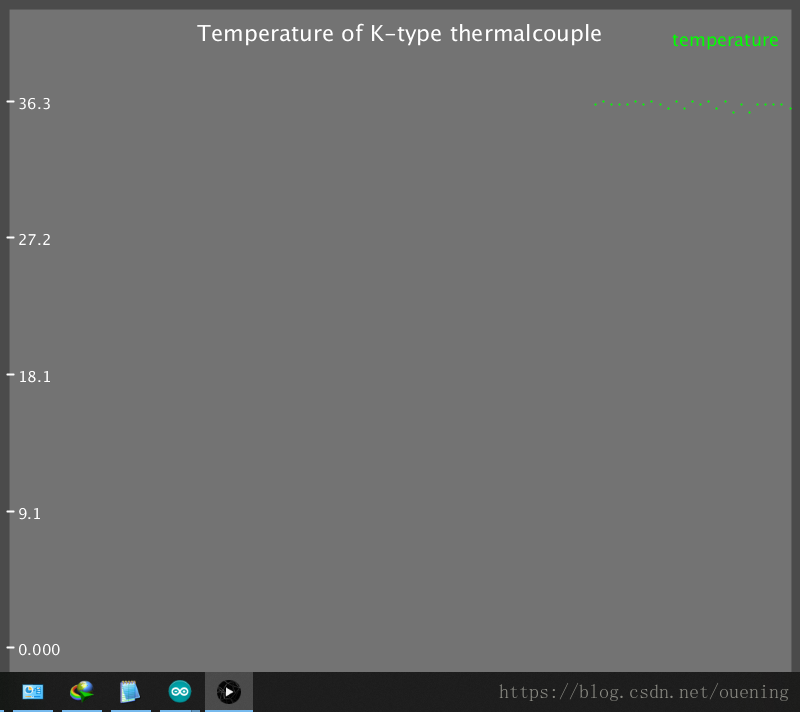
Use this drawing to refresh and redraw every other period of data. I don’t know how to set this.
(3)FlexiPlot
Project address:https://github.com/xcoder123/FlexiPlot_Arduino
Additional drawing tools required:https://github.com/xcoder123/FlexiPlot/releases
No image can be obtained with this drawing tool
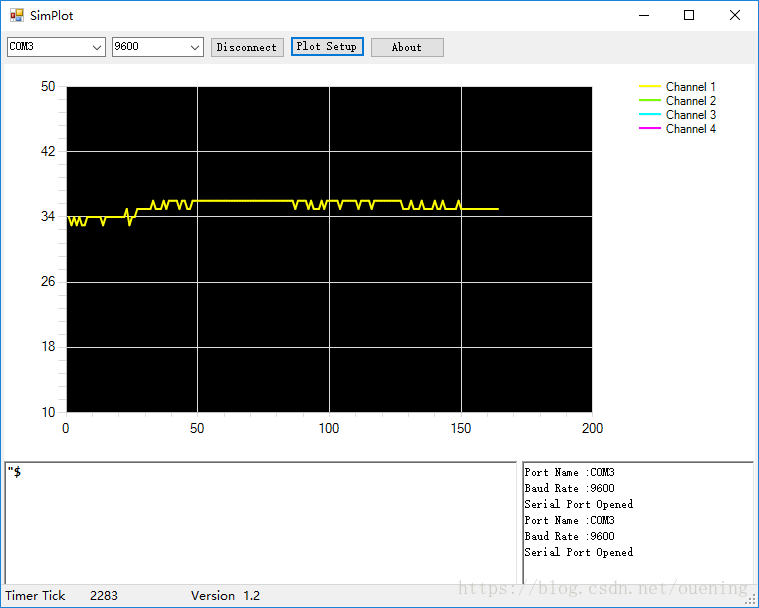
(3) PlotPlus, compatible with SimPlot
Project address:https://github.com/rlogiacco/PlotPlus
Additional drawing tools required:SimPlot (Recommended),Sloeber(An eclipse plugin)
program
#include <MAX6675_Thermocouple.h>
#include <PlotPlus.h>

#define SCK_PIN 3 // The SCK port on the module is connected to pin3
#define CS_PIN 4 // Connect the CS port on the module to pin4
#define SO_PIN 5 // Connect the SO port on the module to pin5
// Don't forget that the 5v and GND on the module should be connected to the arduino development board

MAX6675_Thermocouple* thermocouple = NULL;

// the setup function runs once when you press reset or power the board
void setup() {
  Serial.begin(9600); //Set the serial port baud rate to 9600
  thermocouple = new MAX6675_Thermocouple(SCK_PIN, CS_PIN, SO_PIN);
}

// the loop function runs over and over again forever
void loop() {
  double celsius = thermocouple->readCelsius(); // degrees Celsius
//  double fahrenheit = thermocouple->readFahrenheit();
  plot(celsius);
// Serial.println(celsius); // println printing will automatically add'\r\n', which can be displayed on the serial plotter
  delay(500);// Delay 500ms
}
Open simplot, set the serial port and baud rate, and then connect, the results are as follows
in conclusion:
I feel that the other three are not as good as those shipped with the IDE, especially FlexiPlot. Even after the built-in examples are run, the plots cannot be displayed with the provided software. Send the serial port data to the computer for Processing or visualization, the ultimate method is to write a host computer (undergraduate junior did Qt+Qwt based computer, get the data sent to the computer by stm32 and display/save), now there is not so much time to play electronic things I only practiced my hands occasionally during the holidays, and didn’t want to abandon the knowledge I learned, and didn’t want to toss about 51 or STM32. There is also a rich library on the Internet, and common sensors can be found at random. It is very convenient to use it to make small things.
Intelligent Recommendation
Use the serial port to receive data from Arduino
One example in "Love in Arduino" is to communicate with Arduino with the Processing program. The code is generally as follows, after modification: Still don't drive processing, try node I wa...
[Arduino] serial port data transmission and reception processing
Write with nano development board...
OpenMV and Arduino communication, serial data communication solution
OpenMV and Arduino communication Analyze the function that string will use: Common methods for processing string in Arduino: Show results wiring Arduino code: OpenMV code: Analyze the function that st...

Arduino receives data sent by the serial port
1. We can send data to the computer through the Arduino for observation through the serial monitor. 2. You can call functionsSerial.available()To determine whether data is sent over, thereby receiving...

Arduino serial communication (Serial)
Hardware structure of Arduino serial port Those who know the operating principle of single-chip microcomputers all know that the single-chip microcomputer is an electronic system based on a microcontr...
More Recommendation
Tool recommendation | serial port data visualization
1. Suggestions data visualizationThe term originates from the popularity of Python. In Python, tool libraries such as pyecharts, matplotlib, etc. can be used to draw a bunch of data into vivid charts,...
Multifunctional serial data visualization tool_Debugging Notes
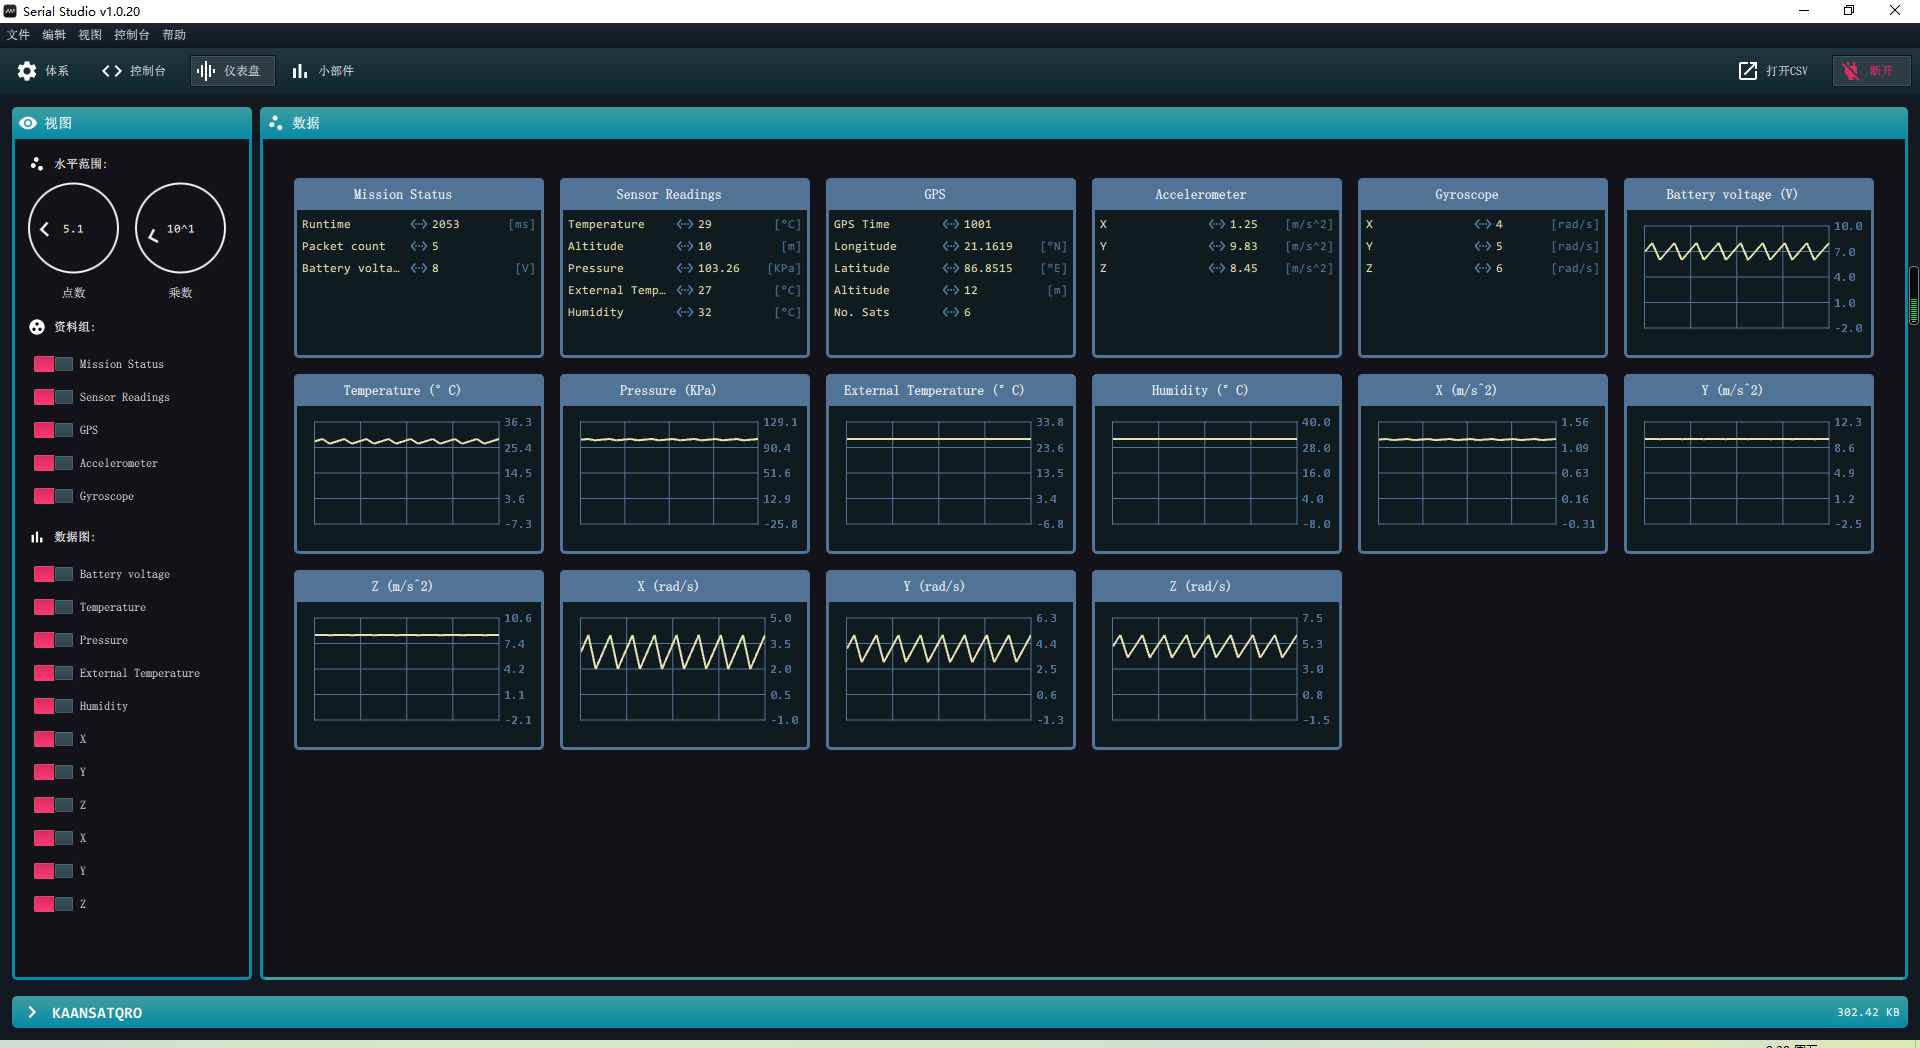
Main software description Serial port virtual software: MX virtual serial port_1.0.1.7 https://www.iotplat.top/#/iot/download Multifunctional serial port data visualization tool Serial-Studio-1.0.20 h...
Arduino reads the data received by the serial port and send data
Arduino Read the data received by the serial port and send data Source program:...
Demonstration serial data visualization tool Serial Stuido (open source free)
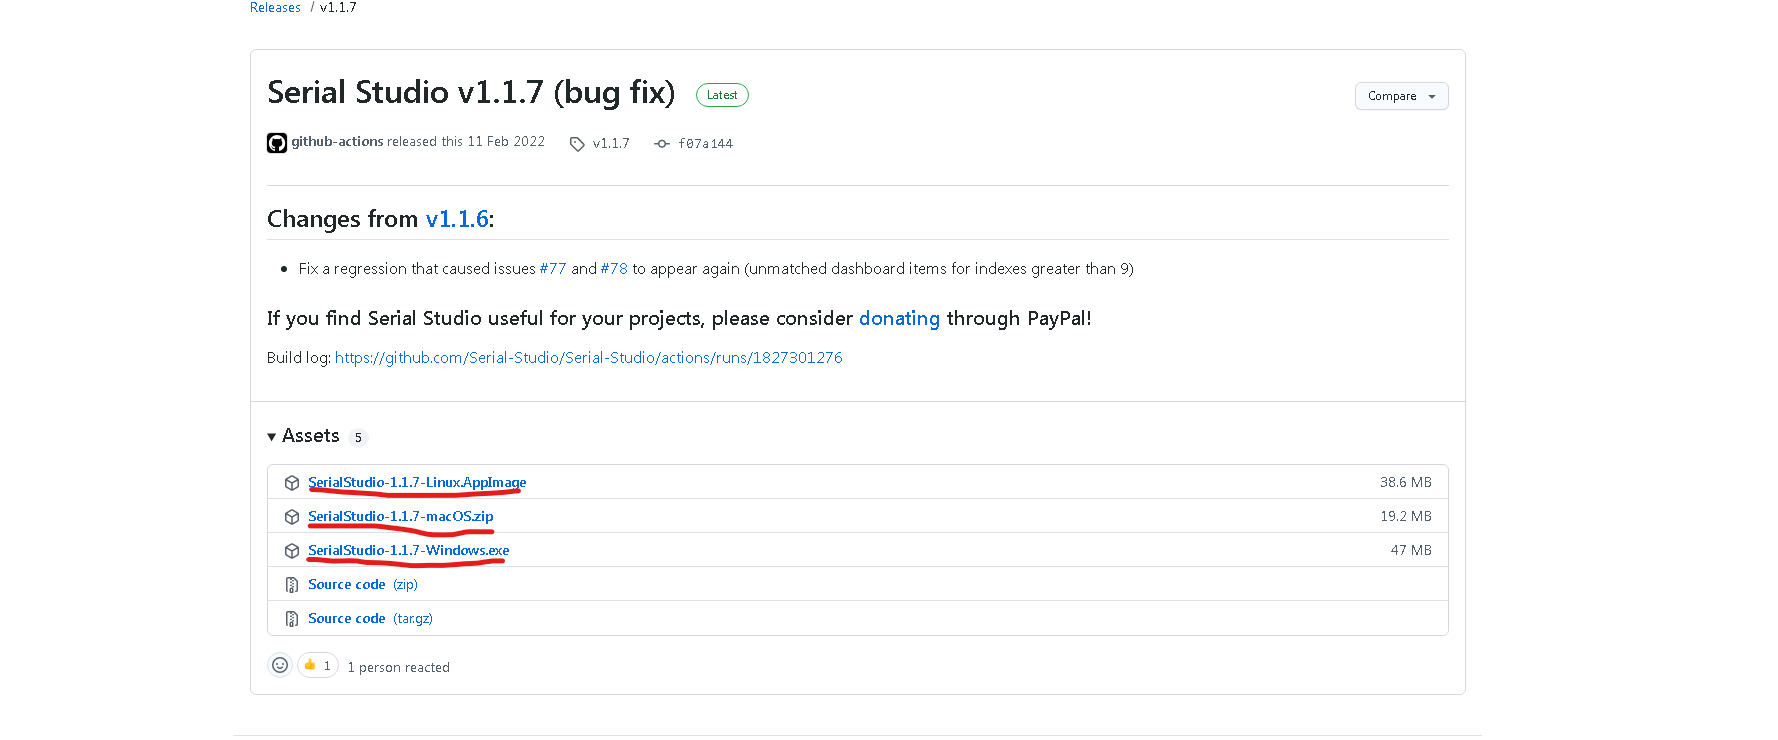
1.Serial Studio introduction and download. Introduction: Serial Studio is a multi -platform, multi -purpose serial data visual application software. Download address: https://github.com/serial-studio/...

Arduino+i2c's 1602 screen shows serial input data.
Wiring of 1602 First, solder the adapter plate to the LCD display (direction as shown above) PCF8574T Arduino GND -> GND VCC -> 5V SDA -> A4 SCL -> A5 This sda scl port is fixed, so...