Random sample consensus (RANSAC simple version) PYTHON implementation
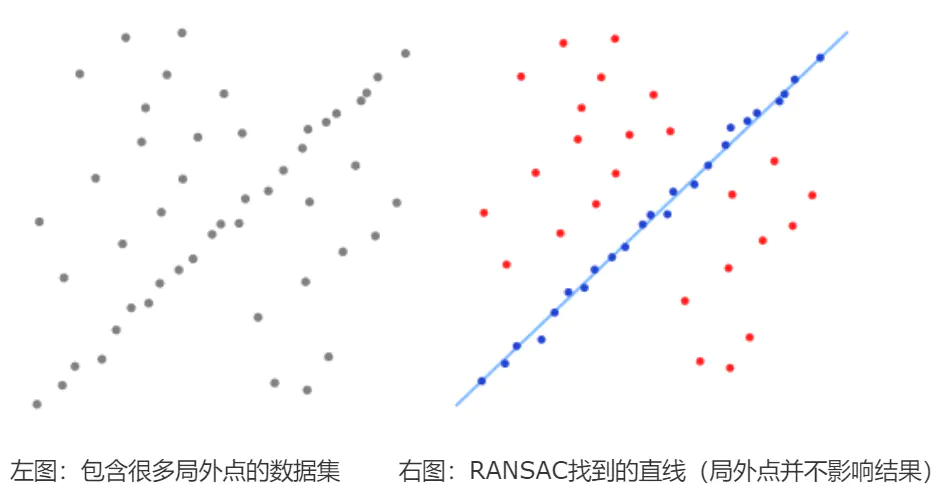
I. Introduction to RANSAC theory
Ordinary least squares is conservative: how to achieve optimality under existing data. It is considered from the perspective of a minimum overall error, and no one can be guilty.
RANSAC is a reformist: first assume that the data has a certain characteristic (purpose), in order to achieve the purpose, appropriate to discard some existing data.
Give a fitting comparison of the least squares fit (red line) and RANSAC (green line) for the first-order line and the second-order curve:

It can be seen that RANSAC can be well fitted. RANSAC can be understood as a way of sampling, so it is theoretically applicable to polynomial fitting, mixed Gaussian model (GMM) and so on.
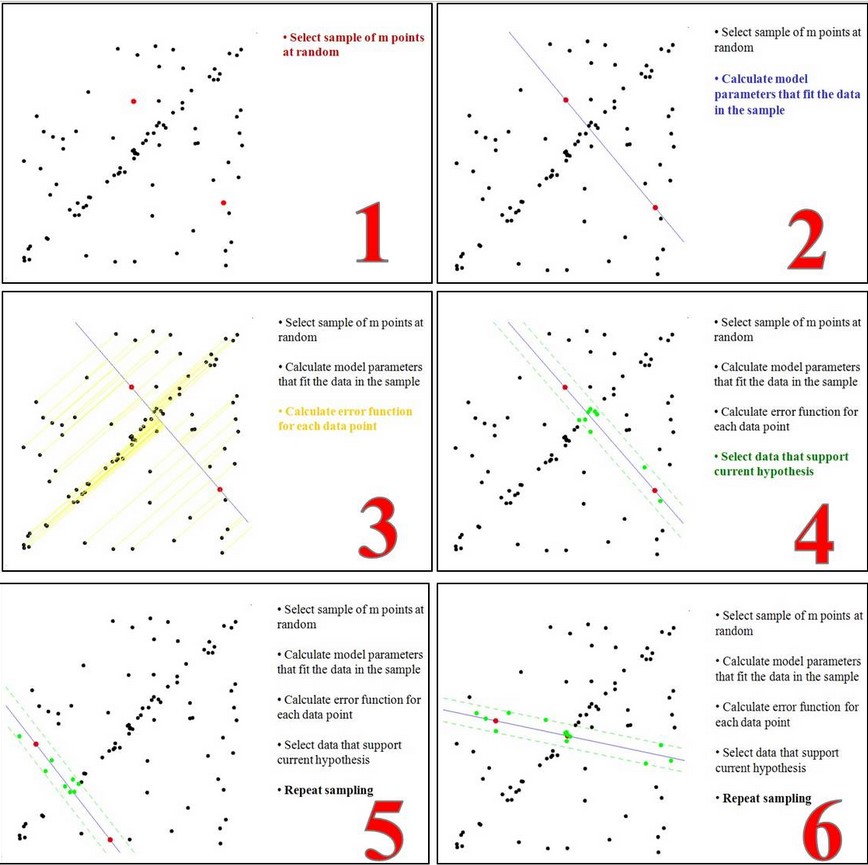
The idea behind RANSAC's simplified version is:
first step: Assume the model (such as the straight line equation), and randomly extract Nums (for example, 2) sample points to fit the model:
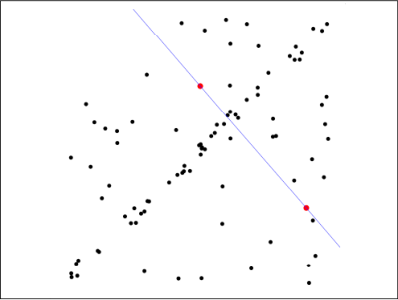
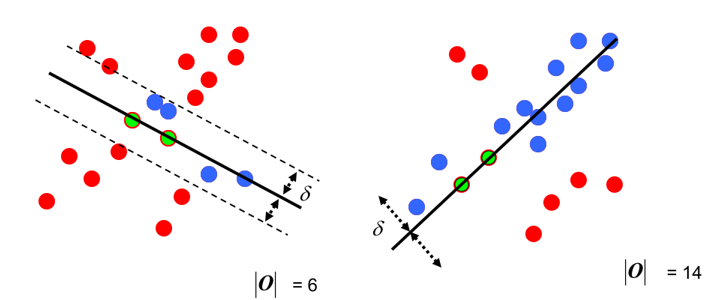
Second step: Because it is not strictly linear, the data points have certain fluctuations. The assumed tolerance range is: sigma, find the point within the tolerance of the distance fitting curve, and count the number of points:
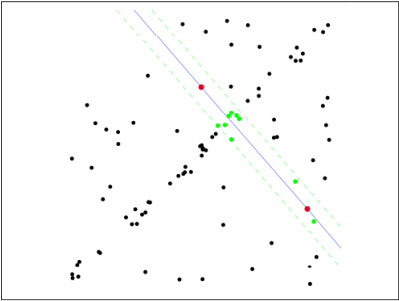
third step: Re-randomly select Nums points, repeat the first step ~ the second step until the end of the iteration:

the fourth step: After each fit,There are corresponding data points in the tolerance rangeFind outMaximum number of data pointsThe situation isFinal fitting result:
At this point: completedA simplified version of RANSACSolve.
This simplified version of RANSAC is only given the number of iterations, and the end of the iteration finds the best. If the number of samples is very large, is it possible to iterate all the time? In fact, RANSAC ignores several issues:
- Number of random samples perSelection of Nums: If the quadratic curve needs at least 3 points to determine, in general, less Nums is easier to get better results;
- Sampling iterationsSelection of Iter: How many times is it repeated, and it is considered that it meets the requirements to stop the operation? Too much computation is too large, too little performance may not be ideal;
- ToleranceSigma selection: sigma takes big and small, and has a greater impact on the final result;
Code:
# _*_ coding:utf-8 _*_

import numpy as np
import scipy as sp
import scipy.linalg as sl

# ransac_fit, ransac_data = ransac(all_data, model, 50, 1000, 7e3, 300, debug=debug, return_all=True)
def ransac(data, model, n, k, t, d, debug=False, return_all=False):
    '''
    Reference: http://scipy.github.io/old-wiki/pages/Cookbook/RANSAC
         Pseudo code: http://en.wikipedia.org/w/index.php?title=RANSAC&oldid=116358182
         Enter:
                 Data - sample point
                 Model - hypothetical model: determine in advance
                 n - the minimum number of sample points required to generate the model
                 k - the maximum number of iterations
                 t - threshold: as a criterion to satisfy the condition of the model
                 d - the minimum number of sample points required when fitting is good, as a threshold
         Output:
                 Bestfit - best fit solution (return nil if not found)

    iterations = 0
         Bestfit = nil #
         Besterr = something really large #late update besterr = thiserr
    while iterations < k
    {
                 Maybeinliers = randomly select n from the sample, not necessarily all in-house points, or even all out-of-office points
                 Maybemodel = n maybeinliers fitted models that may meet the requirements
                 Alsoinliers = emptyset #sample points that meet the error requirements, start blanking
                 For (each one is not a sample point of maybeinliers)
        {
                         If it satisfies maybemodel ie error < t
                                 Add points to alsoinliers
        }
                 If (alsoinliers number of sample points > d)
        {
                         % has a good model, test model conformity
                         Bettermodel = Regenerate better models with all maybeinliers and alsoinliers
                         Thiserr = error metric for all maybeinliers and alsoinliers sample points
            if thiserr < besterr
            {
                bestfit = bettermodel
                besterr = thiserr
            }
        }
        iterations++
    }
    return bestfit
    '''
    iterations = 0
    bestfit = None
         Besterr = np.inf # set default
    best_inlier_idxs = None
    while iterations < k:
        maybe_idxs, test_idxs = random_partition(n, data.shape[0])
                 Maybe_inliers = data[maybe_idxs, :] # Get size(maybe_idxs) line data (Xi, Yi)
                 Test_points = data[test_idxs] # several rows (Xi, Yi) data points
                 Maybemodel = model.fit(maybe_inliers) # fitted model
                 Test_err = model.get_error(test_points, maybemodel) # Calculation error: minimum sum of squares
        also_idxs = test_idxs[test_err < t]
        also_inliers = data[also_idxs, :]
        if debug:
            print ('test_err.min()', test_err.min())
            print ('test_err.max()', test_err.max())
            print ('numpy.mean(test_err)', numpy.mean(test_err))
            print ('iteration %d:len(alsoinliers) = %d' % (iterations, len(also_inliers)))
        if len(also_inliers > d):
                         Betterdata = np.concatenate((maybe_inliers, also_inliers)) #sample connection
            bettermodel = model.fit(betterdata)
            better_errs = model.get_error(betterdata, bettermodel)
                         Thiserr = np.mean(better_errs) # Average error as a new error
            if thiserr < besterr:
                bestfit = bettermodel
                besterr = thiserr
                                 Best_inlier_idxs = np.concatenate((maybe_idxs, also_idxs)) # Update the in-office points and add new points

        iterations += 1
    if bestfit is None:
        raise ValueError("did't meet fit acceptance criteria")
    if return_all:
        return bestfit, {'inliers': best_inlier_idxs}
    else:
        return bestfit


def random_partition(n, n_data):
    """return n random rows of data and the other len(data) - n rows"""
         All_idxs = np.arange(n_data) # Get the n_data subscript index
         Np.random.shuffle(all_idxs) # disrupt the subscript index
    idxs1 = all_idxs[:n]
    idxs2 = all_idxs[n:]
    return idxs1, idxs2


class LinearLeastSquareModel:
         # least squares to find a linear solution for the input model of RANSAC
    def __init__(self, input_columns, output_columns, debug=False):
        self.input_columns = input_columns
        self.output_columns = output_columns
        self.debug = debug

    def fit(self, data):
                 A = np.vstack([data[:, i] for i in self.input_columns]).T #First column Xi-->Line Xi
                 B = np.vstack([data[:, i] for i in self.output_columns]).T #Second column Yi-->Line Yi
                 x, resids, rank, s = sl.lstsq(A, B) # residues: residuals and
                 Return x # return the least squares vector

    def get_error(self, data, model):
                 A = np.vstack([data[:, i] for i in self.input_columns]).T #First column Xi-->Line Xi
        B = np.vstack([data[:, i] for i in self.output_columns]).T #Second column Yi-->Line Yi
                 B_fit = sp.dot(A, model) # Calculated y value, B_fit = model.k*A + model.b
        err_per_point = np.sum((B - B_fit) ** 2, axis=1)  # sum squared error per row
        return err_per_point


def test():
         # Generate ideal data
         N_samples = 500 # number of samples
         N_inputs = 1 # Enter the number of variables
         N_outputs = 1 # number of output variables
         A_exact = 20 * np.random.random((n_samples, n_inputs)) # Randomly generate 500 data between 0-20: row vector
         Perfect_fit = 60 * np.random.normal(size=(n_inputs, n_outputs)) # Random linearity is a random slope
    B_exact = sp.dot(A_exact, perfect_fit)  # y = x * k

         # , least squares can be handled very well
         A_noisy = A_exact + np.random.normal(size=A_exact.shape) # 500 * 1 line vector, representing Xi
         B_noisy = B_exact + np.random.normal(size=B_exact.shape) # 500 * 1 line vector, representing Yi

    if 1:
                 # Add "outside point"
        n_outliers = 100
                 All_idxs = np.arange(A_noisy.shape[0]) # Get index 0-499
                 Np.random.shuffle(all_idxs) # upset all_idxs
                 Outlier_idxs = all_idxs[:n_outliers] # 100 0-500 random outliers
                 A_noisy[outlier_idxs] = 20 * np.random.random((n_outliers, n_inputs)) # Add noise and extra point of Xi
                 B_noisy[outlier_idxs] = 50 * np.random.normal(size=(n_outliers, n_outputs)) # Add noise and Yi of the outlier
    # setup model
         All_data = np.hstack((A_noisy, B_noisy)) # Form ([Xi,Yi]....) shape:(500,2)500 rows and 2 columns
         Input_columns = range(n_inputs) # The first column of the array x:0
         Output_columns = [n_inputs + i for i in range(n_outputs)] # Array last column y:1
    debug = False
         Model = LinearLeastSquareModel(input_columns, output_columns, debug=debug) # Instantiation of class: Generating known models with least squares

    linear_fit, resids, rank, s = sp.linalg.lstsq(all_data[:, input_columns], all_data[:, output_columns])

         # run RANSAC algorithm
    ransac_fit, ransac_data = ransac(all_data, model, 100, 1e4, 7, 30, debug=debug, return_all=True)
    # ransac_fit, ransac_data = ransac(all_data, model, 100, 1e4, 0.01, 30, debug=debug, return_all=True)
    '''
         Enter:
         Data - sample point
         Model - hypothetical model: determine in advance
         n - the minimum number of sample points required to generate the model
         k - the maximum number of iterations
         t - threshold: as a criterion to satisfy the condition of the model
         d - the minimum number of sample points required when fitting is good, as a threshold

         Output:
         Bestfit - best fit solution (return nil, if not found)
    '''

    if 1:
        import pylab

        sort_idxs = np.argsort(A_exact[:, 0])
                 A_col0_sorted = A_exact[sort_idxs] # Array of rank 2

        if 1:
                         Pylab.plot(A_noisy[:, 0], B_noisy[:, 0], 'k.', label='data') # scatter plot
            pylab.plot(A_noisy[ransac_data['inliers'], 0], B_noisy[ransac_data['inliers'], 0], 'bx',
                       label="RANSAC data")
        else:
            pylab.plot(A_noisy[non_outlier_idxs, 0], B_noisy[non_outlier_idxs, 0], 'k.', label='noisy data')
            pylab.plot(A_noisy[outlier_idxs, 0], B_noisy[outlier_idxs, 0], 'r.', label='outlier data')

        pylab.plot(A_col0_sorted[:, 0],
                   np.dot(A_col0_sorted, ransac_fit)[:, 0],
                   label='RANSAC fit')
        pylab.plot(A_col0_sorted[:, 0],
                   np.dot(A_col0_sorted, perfect_fit)[:, 0],
                   # label='exact system')
                   label='perfect fit')
        pylab.plot(A_col0_sorted[:, 0],
                   np.dot(A_col0_sorted, linear_fit)[:, 0],
                   label='linear fit')
        pylab.legend()
        pylab.show()


if __name__ == "__main__":
    test()
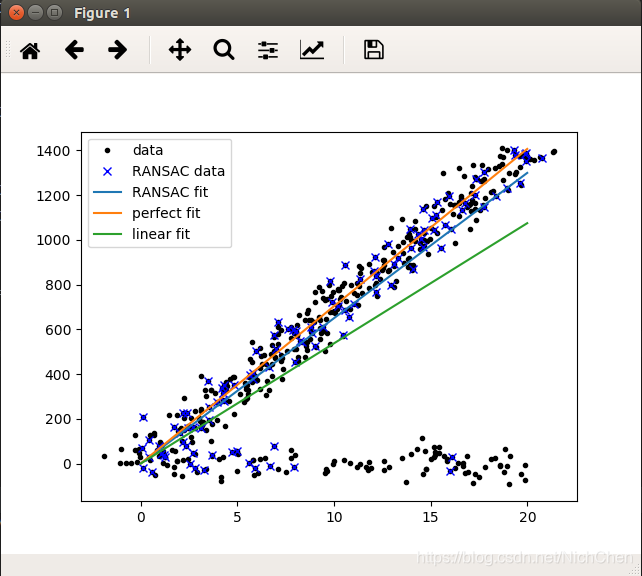
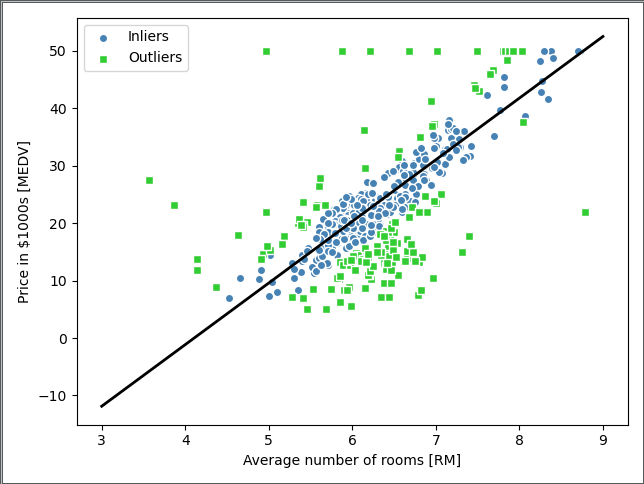
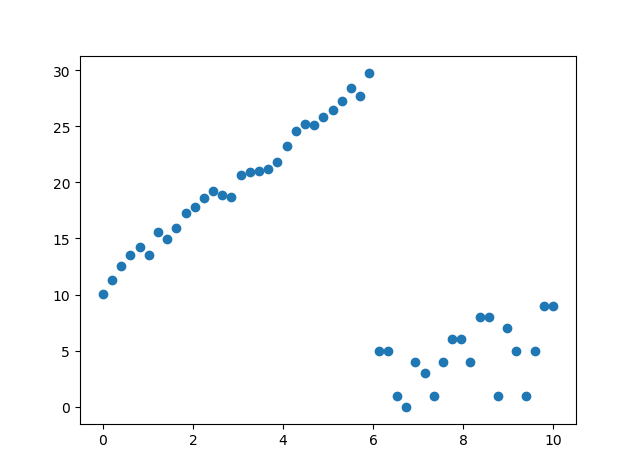
operation result:
Note:
- The role of RANSAC is somewhat similar: the data is divided into two parts, one part is his own person, part is the enemy, and his own person left to discuss things, and the enemy rushed out.
- RANSAC is opening a family meeting, unlike the least squares, which always open a plenary session.
- RANSAC randomly selects some points at the beginning of each generation cycle, and does the least squares method to determine the fitted curve, and retains the best randomly generated fitting curve after multiple cycles.
Reference materials:
Intelligent Recommendation
Random sampling consensus algorithm (RANSAC) detailed
Reprinted link: It can be from a set of observation data sets containing "outliers",Estimate the parameters of the mathematical model through iteration. It is an uncertain algorithm-it has a...
Random sampling consensus algorithm (RANSAC) data collection
Why can't 80% of programmers be architects? >>> This article is translated from Wikipedia, translator:, I have made some additions and modifications on this basis. The original En...
22- Random Sampling Consensus Algorithm RANSAC
Random sample consensus algorithm (Random sample consensus, RANSAC) It seems complicated, but the basic idea is: randomly select two points, and then connect them. Given a tolerance range, the more po...

Straight line fitting method least squares least squares Hough transform M estimation M-Estimators RANSAC random sampling consensus algorithm (random sample consensus)
Least squares We all know that a straight line can be expressed in the form of y=ax+b, where a is the slope and b is the intercept. Least squares is to fit n points so that the overall error from the ...
More Recommendation
Machine learning algorithm (16) python implements random sampling consensus (RANSAC) algorithm
Linear regression models may be severely affected by outliers. In some cases, a small amount of data may have a large influence on the estimated model coefficients. In addition to eliminating outliers...

Random Sampling Consistency Algorithm (Random Sample Consensus)
Random sample consensus (RANSAC) is an iterative method to estimate parameters of a mathematical model from a set of observed data that contains outliers, when outliers are to be accorded no influence...
How to use the Random Sample Consensus model
In this tutorial we will learn how to use in a flat modelRandomSampleConsensusTo get a cloud that fits the model. # RANdom SAmple ConsensusAbbreviation isRANSAC, which is an iterative method for estim...
Ransac algorithm python source implementation
The ransac algorithm was first introduced in statistics, and gradually applied to the image field. It is very robust to noise. The algorithm is as follows:...
Ransac algorithm detailed + python implementation
Algorithm description The basic assumption of Ransac is: (1) The data consists of "local point", for example: data distribution can be explained by some model parameters; (2) "Out of th...