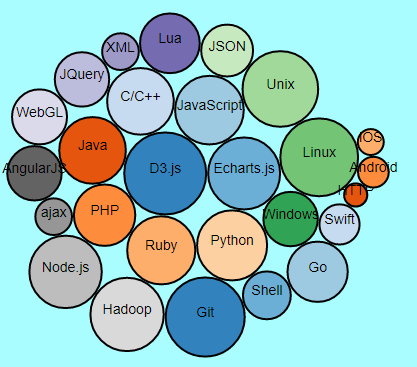
The fourth bullet of the D3 series-drawing a bubble chart
I don't know how to say it, I only know how to write it. Send it out first, and restructure the article carefully later.
data set:
{
"children":
[
	{ "name": "D3.js", 	"weight": 100 },
	{ "name": "Echarts.js", 	"weight": 77 },
	{ "name": "JavaScript", 	"weight": 70 },
	{ "name": "C/C++", 	"weight": 66 },
	{ "name": "Java", 	"weight": 66 },
	{ "name": "PHP", 	"weight": 56 },
	{ "name": "Ruby", 	"weight": 69 },
	{ "name": "Python", 	"weight": 73 },
	{ "name": "Windows", 	"weight": 44 },
	{ "name": "Linux", 	"weight": 90 },
	{ "name": "Unix", 	"weight": 85 },
	{ "name": "JSON", 	"weight": 40 },
	{ "name": "XML", 	"weight": 20 },
	{ "name": "JQuery", 	"weight": 44 },
	{ "name": "AngularJS", 	"weight": 44 },
	{ "name": "ajax", 	"weight": 20 },
	{ "name": "Node.js", 	"weight": 78 },
	{ "name": "Go", 		"weight": 54 },
	{ "name": "Swift", 	"weight": 24 },
	{ "name": "HTTP", 	"weight": 8 },
	{ "name": "Android", 	"weight": 14 },
	{ "name": "iOS", 	"weight": 10 }
]
}
HTML file program:
<!DOCTYPE html>
<html lang="en">
<head>
    <meta charset="UTF-8">
    <title>D3Study</title>
    <script type="text/javascript"src="D3/d3.min.js"></script>
    <style>

        .bubble circle{
            stroke: black;
            stroke-width: 2px;
        }

        .bubble text{
            fill: black;
            font-size: 14px;
            font-family: arial;
            text-anchor: middle;
        }

    </style>

</head>
<body>
<div id="bubble" style="height: 400px;background-color:#a9fdff"></div>
</body>
<script type="text/javascript" src="D3/Bubble.js"></script>
</html>
JS file program:
var width  = 400;
var height = 400;

var svg3 = d3.select("#bubble")
    .append("svg")
    .attr("width", width)
    .attr("height", height);

var pack = d3.layout.pack()
    .size([ width, height ])
    .sort(null)
    .value(function(d){
        return d.weight;
    })
    .padding(2);

d3.json("Data/BubbleData.json",function(error, root){

    var nodes = pack.nodes(root);

    console.log(nodes);

    var color = d3.scale.category20c();

    var bubbles = svg3.selectAll(".bubble")
        .data(nodes.filter(function(d) {
            return !d.children;
        }))
        .enter()
        .append("g")
        .attr("class","bubble");

    bubbles.append("circle")
        .style("fill",function(d,i){
            return color(i);
        })
        .attr("cx",function(d){ return d.x; })
        .attr("cy",function(d){ return d.y; })
        .attr("r",function(d){ return d.r; });

    bubbles.append("text")
        .attr("x",function(d){ return d.x; })
        .attr("y",function(d){ return d.y; })
        .text(function(d){
            return d.name;
        });

});
final effect:
Intelligent Recommendation
D3.V4 (two)-bubble chart
It is very simple to draw a bubble chart. D3 provides a layout algorithm. You only need to input the data to get the position of the bubble, and then draw it. data Here is the code: ...
D3 Two-dimensional chart drawing series (30) Parallel coordinate system line chart
Previous: Radial tree diagram The code structure and the introduction of the Chart object that initializes the canvas, please see firstHere The complete source code address of this picture:Here 1 Char...
D3 bubble chart axis non-number type
Requirement: d3 Usually we see that either the x y axis is number or one of them is number So how do you draw x-y axes that are non-numeric bubble charts? To achieve the following picture: Using the v...

Detailed explanation of Bubble Chart in D3.js
Bubble Chart Let’s talk about the beautiful and romantic bubble map today~ A bubble chart is a chart that displays three-dimensional data. The entity of each triple (v1, v2, v3) with related dat...
D3 Two-dimensional chart drawing series (33) Scalable rectangular tree diagram
Previous: Zoomable closed graph The code structure and the introduction of the Chart object that initializes the canvas, please see firstHere The complete source code address of this picture:Here 1 Ch...
More Recommendation
D3.js + Canvas drawing an organization chart
Use D3.js default svg rendering The default tree view of D3 uses svg, such as this example from the D3 author: https://bl.ocks.org/mbostock/4339083 There are good or bad things about using svg: The ad...
Visualization tool-D3-basic chart drawing (line)
In the research and application of information visualization, every complex chart and module is composed of several relatively basic and simple charts. These charts include scatter charts, fan charts,...
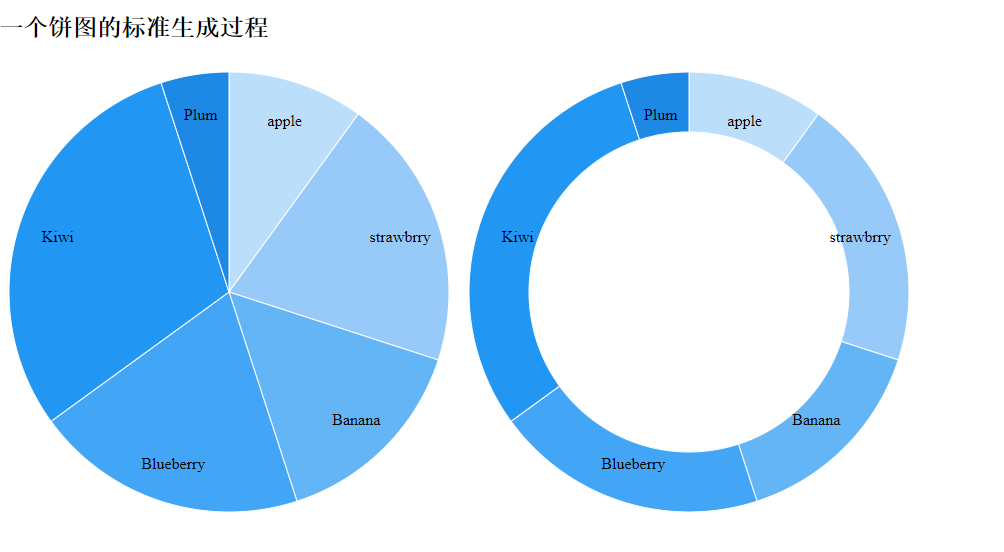
D3 learning articles-drawing a pie chart
D3 steps to draw a pie chart Declare margin, radius size, color Generate radian generator-src generator Declare pie chart generator Define canvas define svg Load data append g elements (arc) is equiva...
Data Visualization - D3 Implementing Pie Chart Drawing
There are two ways to draw pieces with D3, one is based on radiative visualization, one is based on data-based visualization. Based on radiative: Based on data: Visualization based on radian-drawn mov...
VUE introduces D3 drawing flow chart
In this project, you can directly introduce more than the items in the project can be used in main.js, which is introduced in the Vue file. Need notes I have labeled it in the code. There is a book of...