5 sklearn's data set-datasets
tags: Big Data Visualization sklearn algorithm data
sklearn data sets-datasets
1 sklearn powerful database
Data sets, there are many useful databases that can be used to learn algorithm models.
eg: boston house prices, diabetes, numbers, Iris flowers.
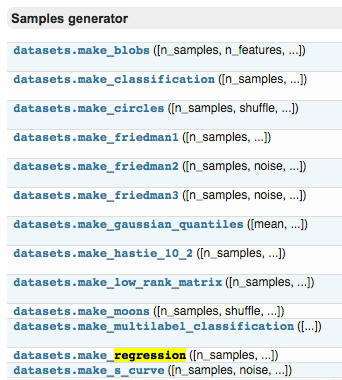
There are two main types:
-Packaged classic data.eg: boston house prices, diabetes, numbers, Iris flowers. Start with "load" in the code.
-Design parameters by yourself, and then generate data, such as data used to train linear regression models (powerful). Start with "make" in the code
2 Document introduction
2.1 Classical data
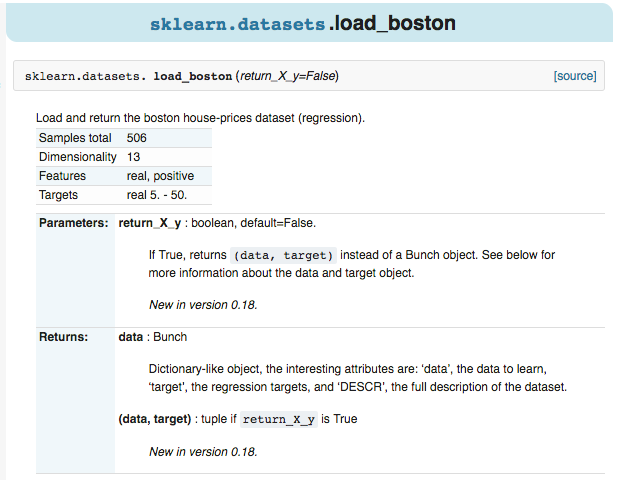
For example, click to enter the boston housing price data, you can see the total number of samples, attributes, and label information.
2.2 Structure data
If you generate data yourself, enter the number of sample, feature, target, etc. in the form of a function.
sklearn.datasets.make_regression(n_samples=100, n_features=100, n_informative=10, n_targets=1, bias=0.0, effective_rank=None, tail_strength=0.5, noise=0.0, shuffle=True, coef=False, random_state=None)[source]3 Example 1, house price
# Import a full database
from sklearn import datasets
# Split data module, divide the data set into training set and test set
from sklearn.cross_validation import train_test_split
# Import linear regression method
from sklearn.linear_model import LinearRegression
# Load data
loaded_data = datasets.load_boston()
# Get data input and output, sklearn is very regular. The data is divided into two parts: data (input) and target (output)
data_X = loaded_data.data
data_y = loaded_data.target
# Divide the data set into training set and test set, and the order of cut is disordered. The test set accounts for 30%
X_train,X_test,y_train,y_test = train_test_split(data_X,data_y,test_size=0.3)
# Create a model. You can directly use the default values to build the model. The default values are also good. You can also change the parameters yourself to make the model better.
model = LinearRegression()
# Use training data to train the model
model.fit(X_train, y_train)
# Then print out the predicted value, here use the first 4 of X to predict, and print the true value as a comparison.
print(model.predict(X_test[:4, :]))
print(y_test[:4])
'''
The results are as follows:
[ 19.56926228 33.20448769 31.89484639 39.34984426]
[ 18.6 33.2 30.3 43.5]
'''
4 Example 2: Create virtual data and visualize
# Import a full database, and use its second aspect here: structure data
from sklearn import datasets
# Import linear regression method
from sklearn.linear_model import LinearRegression
# drawing equipment
import matplotlib.pyplot as plt
# Construct data for regression make_regression
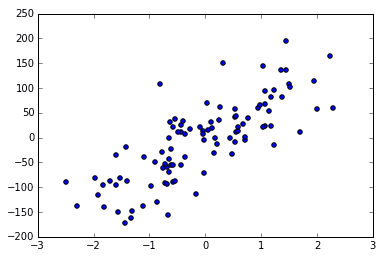
# Meaning of the parameters: 100 examples, 1 feature, 1 output, and the size of the noise is 5
X,y = datasets.make_regression(n_samples=100,n_features=1,n_targets=1,noise=2)
# Visualize the data we just created
plt.plot(X,y,'o')
plt.show()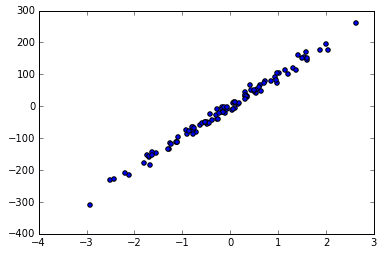
You can see the data used for Linear Regression generated by the function.
The larger the noise, the more discrete the points, for example, the noise changes from 10 to 50.
Intelligent Recommendation
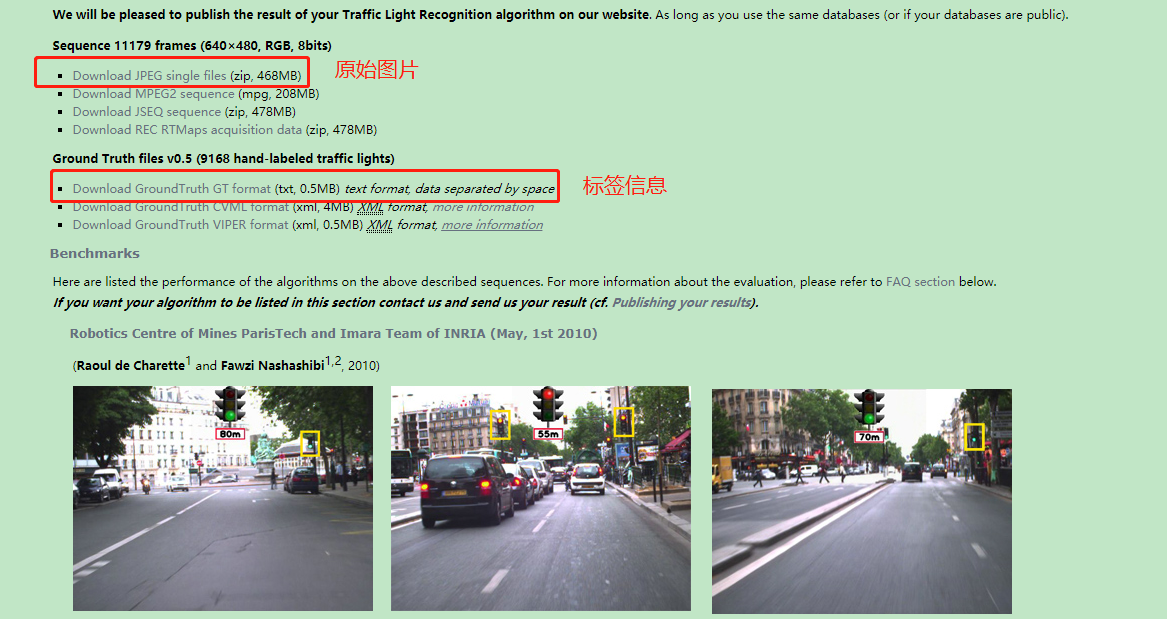
[Datasets] Analysis of LaRa Traffic Light Data Set
Purpose: parse the LaRa traffic signal data set into VOC format. is divided into four categories: ‘Traffic_Light_go’, ‘Traffic_Light_stop’, ‘Traffic_Light_ambiguous&rsquo...
SynthText -datasets data set analysis (python implementation)
I don’t need to introduce this data set much, but there is very little information in this area on the Internet (introducing the format of the data set). I recommend this blogger’s analysi...
Read the mnist data set locally with Pytorch DataSets
Article catalog 1, problem description 2, solution 3, the principle explanation 1, problem description I want to load the data set directly with DataSets.mnist, but! too slow! Opened VPN to download f...
Target Detection Series (Preface) Data Set DataSets
Target Detection Series (PREFACE) - Dataset Public data set(Pascal Voc // Coco) First, Pascal Voc format data setOfficial website Labeling tool 1, data set general format VOC2007 Annotations All XML t...
[Tensorflow Tutorial Notes] Tensorflow DataSets Data Set
contents Tensorflow DataSets Data Set hint Tensorflow DataSets Data Set TensorFlow Datasets It is a collection of data sets that open boxes, including dozens of commonly used machine learning data set...
More Recommendation
COCO data set adds fields and merged datasets
1. Add field: 2. Merge data set...
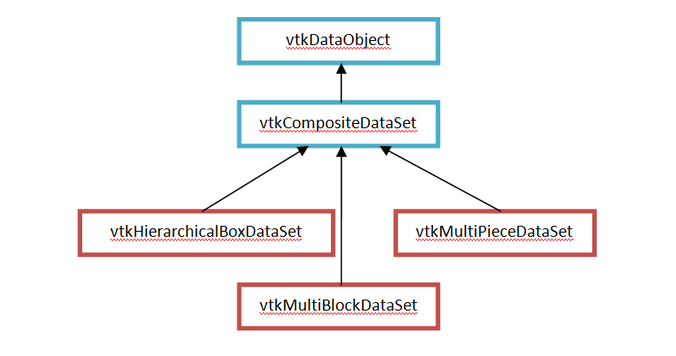
ParaView: Composition DataSets (composite data set)
Composite Datasets VTK5.0 introduced a composite dataset. The composite dataset is only a data set consisting of other data sets. This concept is very useful when defining a complex structure composed...
k-nearest neighbor (using sklearn's Orioles data set)
The mechanism of kNN is to select the nearest k points around the target. Which of these k points account for the largest proportion can classify the target into that category, that is, there are many...
SVR regression implementation based on Sklearn's watermelon data set
The "density" of the watermelon data set 3.0α is the input "sugar rate" as the output, and a SVR is trained. This blog is a SVR regression implementation based on Sklearn's w...
Data Mining Algorithm and Practice (20): Sklearn Channel Data Set DataSets
As the data mining kit, Sklearn not only provides an algorithm implementation, but also provides data sets through the Sklearn.DataSets module. It has three data set API interfaces to obtain data sets...