pyqtgraph embedded in pyqt5 dynamic update
tags: qt Development language python
pyqtgraph embedded in pyqt5 dynamic update
1. Library you need to use:
- PyQt5
- Pyqt5-tools
- pyqtgraph
- numpy
- sys
2. Implementation tools:
- pycharm
- Qt-designer
Third, the reason for choosing pyqtgraph:
The selection of pyqtgraph embedded pyqt5 is mainly because of the following reasons:
- Pyqtgraph itself is a graphical library based on the Python language, and the compatibility with PYQT5 is better. For novices like me, it is mainly to avoid contacting language other than Python. The three -way graphics library, but the other module "QWEBENGINEVIEW" needs to be used, which also involves the JS language. Although the graphic was successfully embedded in Qt, it was stuck in the data interaction. It took a long time to solve it and did not solve it. Finally, I gave up, after all, Python slag has no time to consume JS. Essence
- PYQTGRAPH focuses on high -data refreshing requirements.
- The main purpose is to display the changes in the pressure sensor in real time. The pursuit of practicality is not so high for the visual effect. Although EChart's visual effect is better, it is not stronger to learn the residue. There is no stronger than that (the last stubbornness of the dregs) and so on.
Fourth, overall thinking:
The main ideas are as follows:
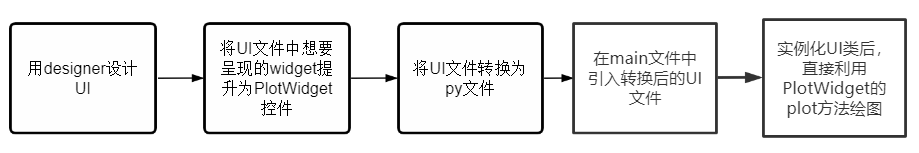
Method about the official documentation of widget <How to use pyqtgraph — pyqtgraph 0.12.3 documentation>:
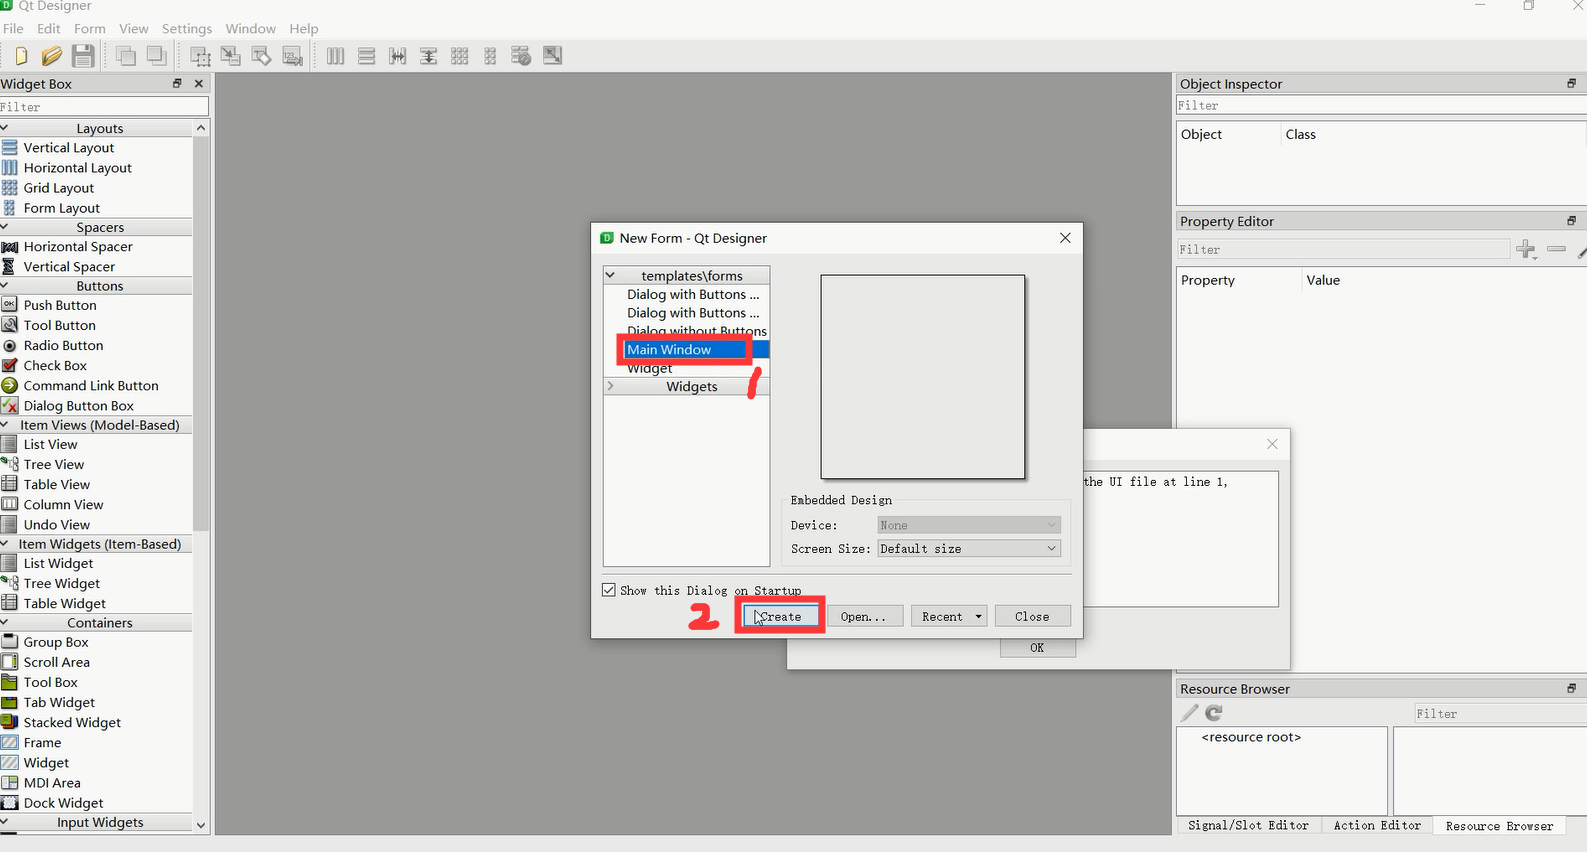
- Create a QGraphicsView control in the Designer ("Graphics View" under the "Display Widgets" class).
- Right -click on the QGraphicsView control to select "Promote"
- Enter the category name you want to become in the "Promoted class name" column, such as the "Plotwidget" class or "GraphicsLayoutWidget" class. This step is very important. Only the "PlotWidget" class has the PLOT method
- Enter "Pyqtgraph" under "Header File".
- Click "ADD", and then click "Promote".
Five, code
method one:
(Directly use the "improvement" method in the Designer to increase the control of the chart to the "PlotWidget" control, so that the PLOT method can be used))
import sys
from PyQt5.QtWidgets import QApplication, QMainWindow
from PyQt5.QtCore import QTimer
from untitled import Ui_MainWindow
import pyqtgraph as pg
import numpy as np
#For the generation of random numbers

class MyWindow(QMainWindow):

    def __init__(self):
        super().__init__()

        self.ui=Ui_MainWindow()
        #Instantiated main window

        self.ui.setupUi(self)
        #Initialized main window

        self.DATA=np.random.normal(size=50)
		#Generate 50 random numbers

        self.echart=self.ui.graphicsView.plot(self.DATA)
        "" "" Plot method drawing the plotwidget control under the UI class directly, the "GraphicsView" here is the instance name of the plotwidget, which can be seen in the transformed UI file
        """

        self.X_ptr1 = 0
        #Used to record the position of the X -axis

        self.timer =QTimer()
        # Instance a timer

        self.timer.timeout.connect(self.update_data)
        # Bind the timer signal to the update_data function

        self.timer.start(100)
        # Start the timer, the overflow time is set to 100ms, which can be understood as 100ms refresh the data once

    def update_data(self):#Data update function

        self.DATA[:-1] = self.DATA[1:]#One of the number in the list

        self.DATA[-1] = np.random.normal()
        #Call the random function to generate a random number and place it on the last one of the data list

        self.echart.setData(self.DATA,)
        # Put the updated data list in the chart

        self.X_ptr1 += 1#Call the update_data function X coordinates to increase 1

        self.echart.setPos(self.X_ptr1,0)
        # Put the updated X coordinate into the chart


if __name__ == '__main__':
    app = QApplication(sys.argv)
    myWin = MyWindow()
    myWin.show()
    sys.exit(app.exec_())
Method Two:
(Main use of GridLayout's AddWidget method to add PlotWidget to GridLayout):
import sys
from PyQt5.QtWidgets import QApplication, QMainWindow
from PyQt5.QtCore import QTimer
from untitled import Ui_MainWindow
import pyqtgraph as pg
import numpy as np
#For the generation of random numbers

class MyWindow(QMainWindow):

    def __init__(self):
        super().__init__()
        #Initialized parent class

        self.ui=Ui_MainWindow()
        #Instantiated UI main window

        self.ui.setupUi(self)
        #Initialized main window

        self.DATA=np.random.normal(size=50)
        #Generate 50 random numbers

        self.echart=pg.PlotWidget()
        #Instantiated a plotwidget control

        self.ui.gridLayout.addWidget(self.echart)
        #Plotwidget control to the GridLayout container

        self.my_echart=self.echart.plot(self.DATA,)
        #

        self.X_ptr1 = 0
        #Used to record the position of the X -axis

        self.timer =QTimer()
        # Instance a timer

        self.timer.timeout.connect(self.update_data)
        # Bind the timer signal to the update_data function

        self.timer.start(100)
        # Start the timer, the overflow time is set to 100ms, which can be understood as 100ms refresh the data once

    def update_data(self):#Data update function

        self.DATA[:-1] = self.DATA[1:]#One of the number in the list

        self.DATA[-1] = np.random.normal()
        #Call the random function to generate a random number and place it on the last one of the data list

        self.my_echart.setData(self.DATA,)
        # Put the updated data list in the chart

        self.X_ptr1 += 1#Call the update_data function X coordinates to increase 1

        self.my_echart.setPos(self.X_ptr1,0)
        # Put the updated X coordinate into the chart


if __name__ == '__main__':
    app = QApplication(sys.argv)
    myWin = MyWindow()
    myWin.show()
    sys.exit(app.exec_())
UI code after conversion
# -*- coding: utf-8 -*-
# Created by: PyQt5 UI code generator 5.15.4

from PyQt5 import QtCore, QtGui, QtWidgets

class Ui_MainWindow(object):
    def setupUi(self, MainWindow):
        MainWindow.setObjectName("MainWindow")
        MainWindow.resize(1004, 789)
        self.centralwidget = QtWidgets.QWidget(MainWindow)
        self.centralwidget.setObjectName("centralwidget")

        self.graphicsView = PlotWidget(self.centralwidget)
        self.graphicsView.setGeometry(QtCore.QRect(90, 170, 411, 281))
        self.graphicsView.setObjectName("graphicsView")

        self.gridLayoutWidget = QtWidgets.QWidget(self.centralwidget)
        self.gridLayoutWidget.setGeometry(QtCore.QRect(560, 170, 401, 281))
        self.gridLayoutWidget.setObjectName("gridLayoutWidget")

        self.gridLayout = QtWidgets.QGridLayout(self.gridLayoutWidget)
        self.gridLayout.setContentsMargins(0, 0, 0, 0)
        self.gridLayout.setObjectName("gridLayout")

        self.label = QtWidgets.QLabel(self.centralwidget)
        self.label.setGeometry(QtCore.QRect(220, 490, 111, 41))
        self.label.setObjectName("label")
        self.label_2 = QtWidgets.QLabel(self.centralwidget)
        self.label_2.setGeometry(QtCore.QRect(700, 490, 111, 41))
        self.label_2.setObjectName("label_2")
        MainWindow.setCentralWidget(self.centralwidget)
        self.statusbar = QtWidgets.QStatusBar(MainWindow)
        self.statusbar.setObjectName("statusbar")
        MainWindow.setStatusBar(self.statusbar)

        self.retranslateUi(MainWindow)
        QtCore.QMetaObject.connectSlotsByName(MainWindow)

    def retranslateUi(self, MainWindow):
        _translate = QtCore.QCoreApplication.translate
        MainWindow.setWindowTitle(_translate("MainWindow", "MainWindow"))
        self.label.setText(_translate("MainWindow", "method one"))
        self.label_2.setText(_translate("MainWindow", "Method Two"))
from pyqtgraph import PlotWidget
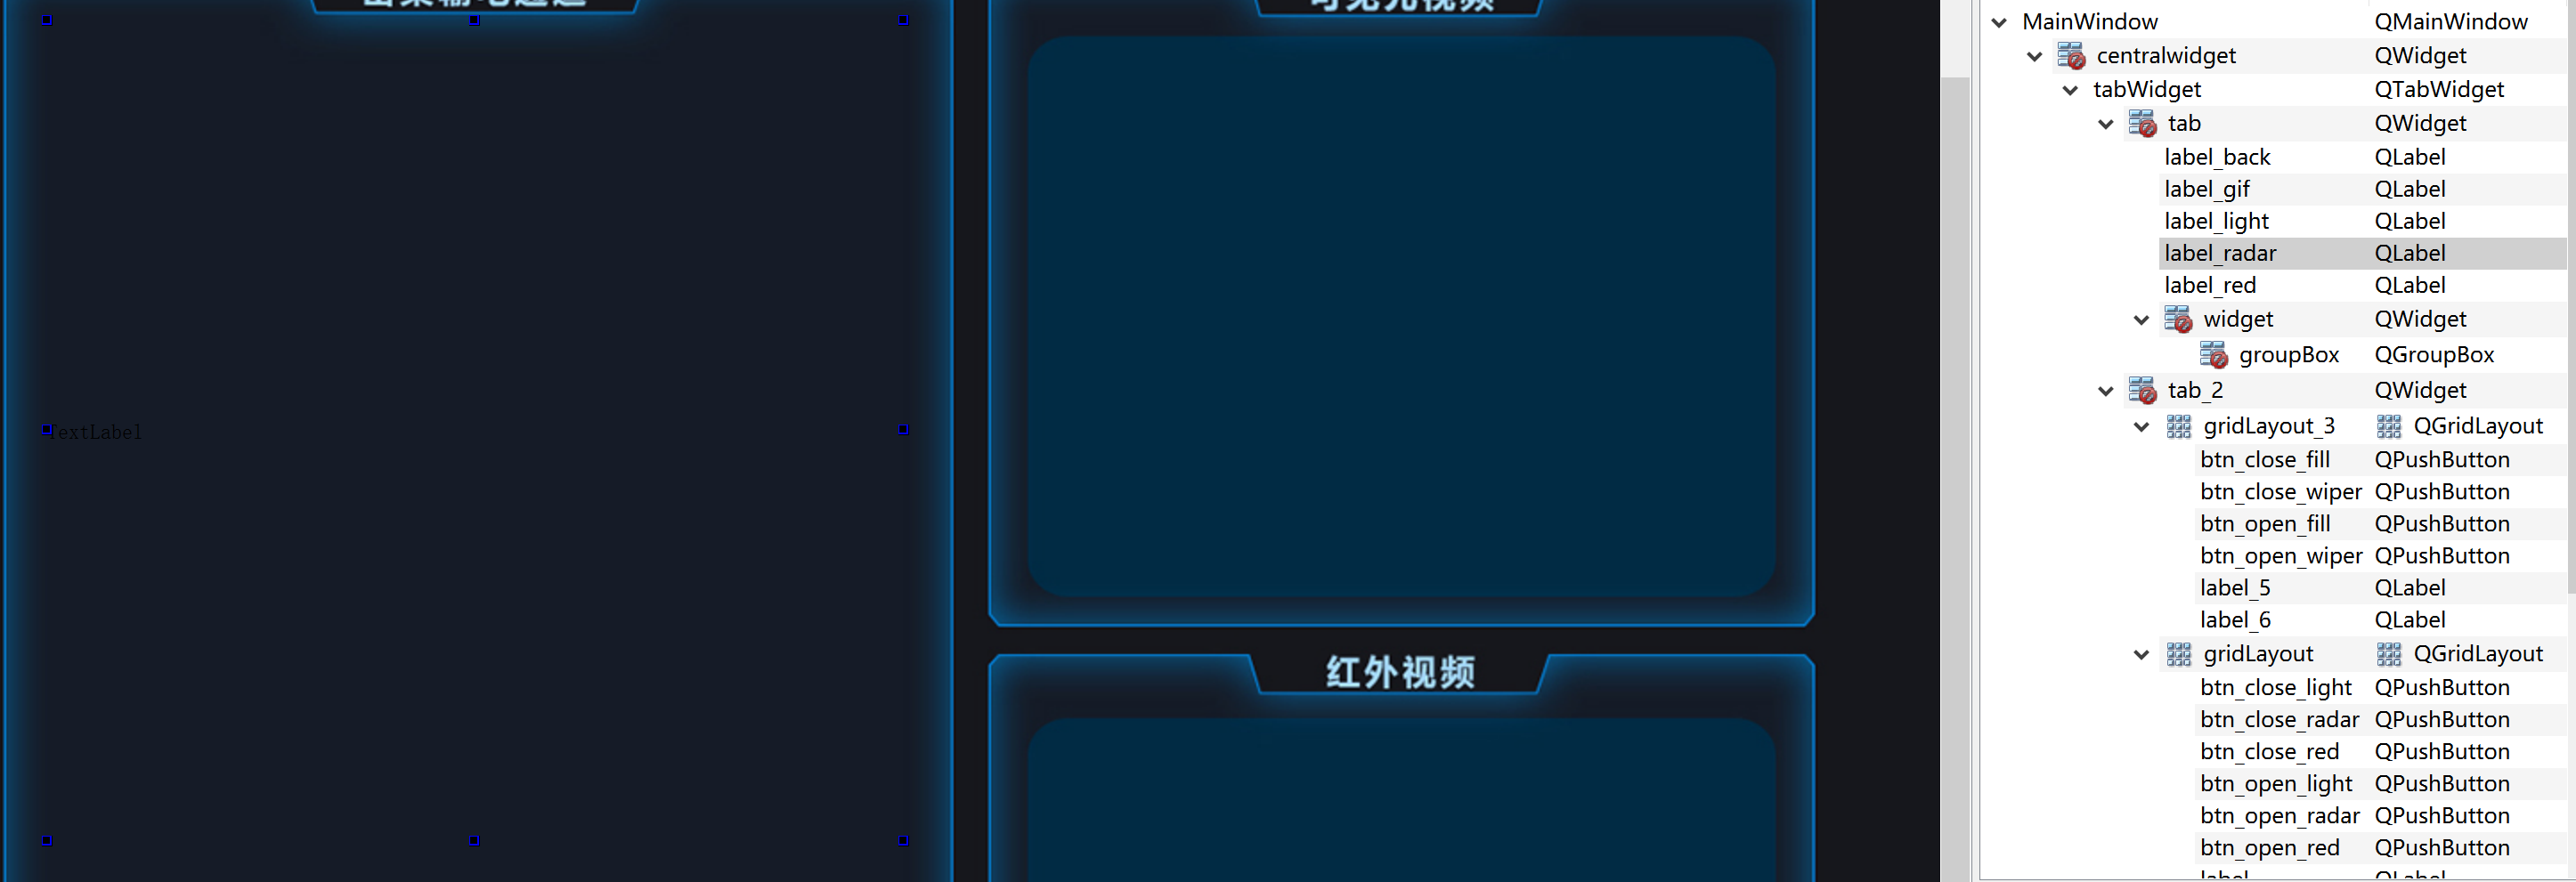
UI layout

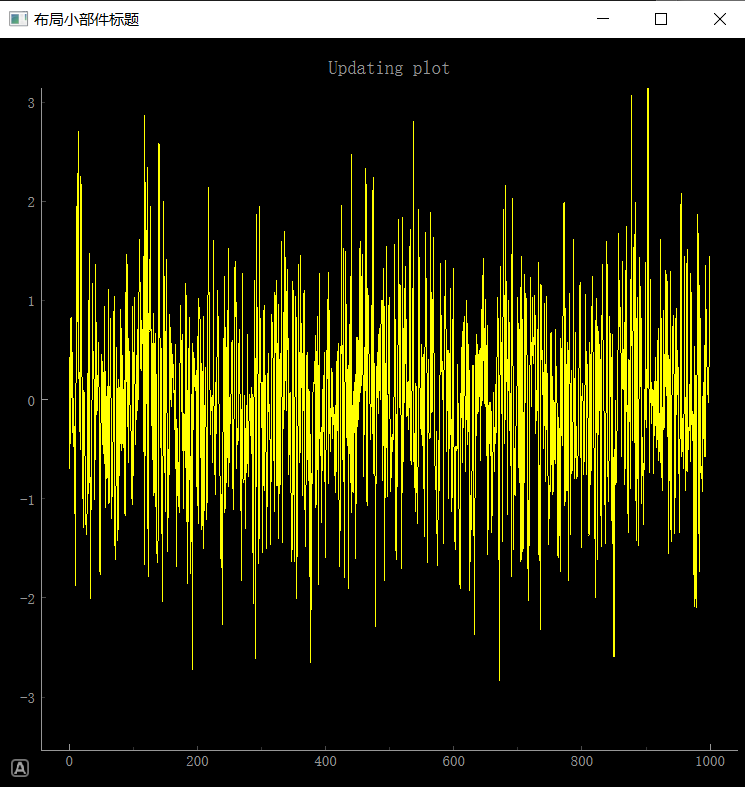
The effect of the two methods finally achieved
At the end
Just write here, because it is not software in itself, it is inevitable that there are omissions written. The original intention is just to write a state of the upper machine to monitor the sensor. The elderly have tried their best to record the results during this time. Please give me more advice.
Intelligent Recommendation
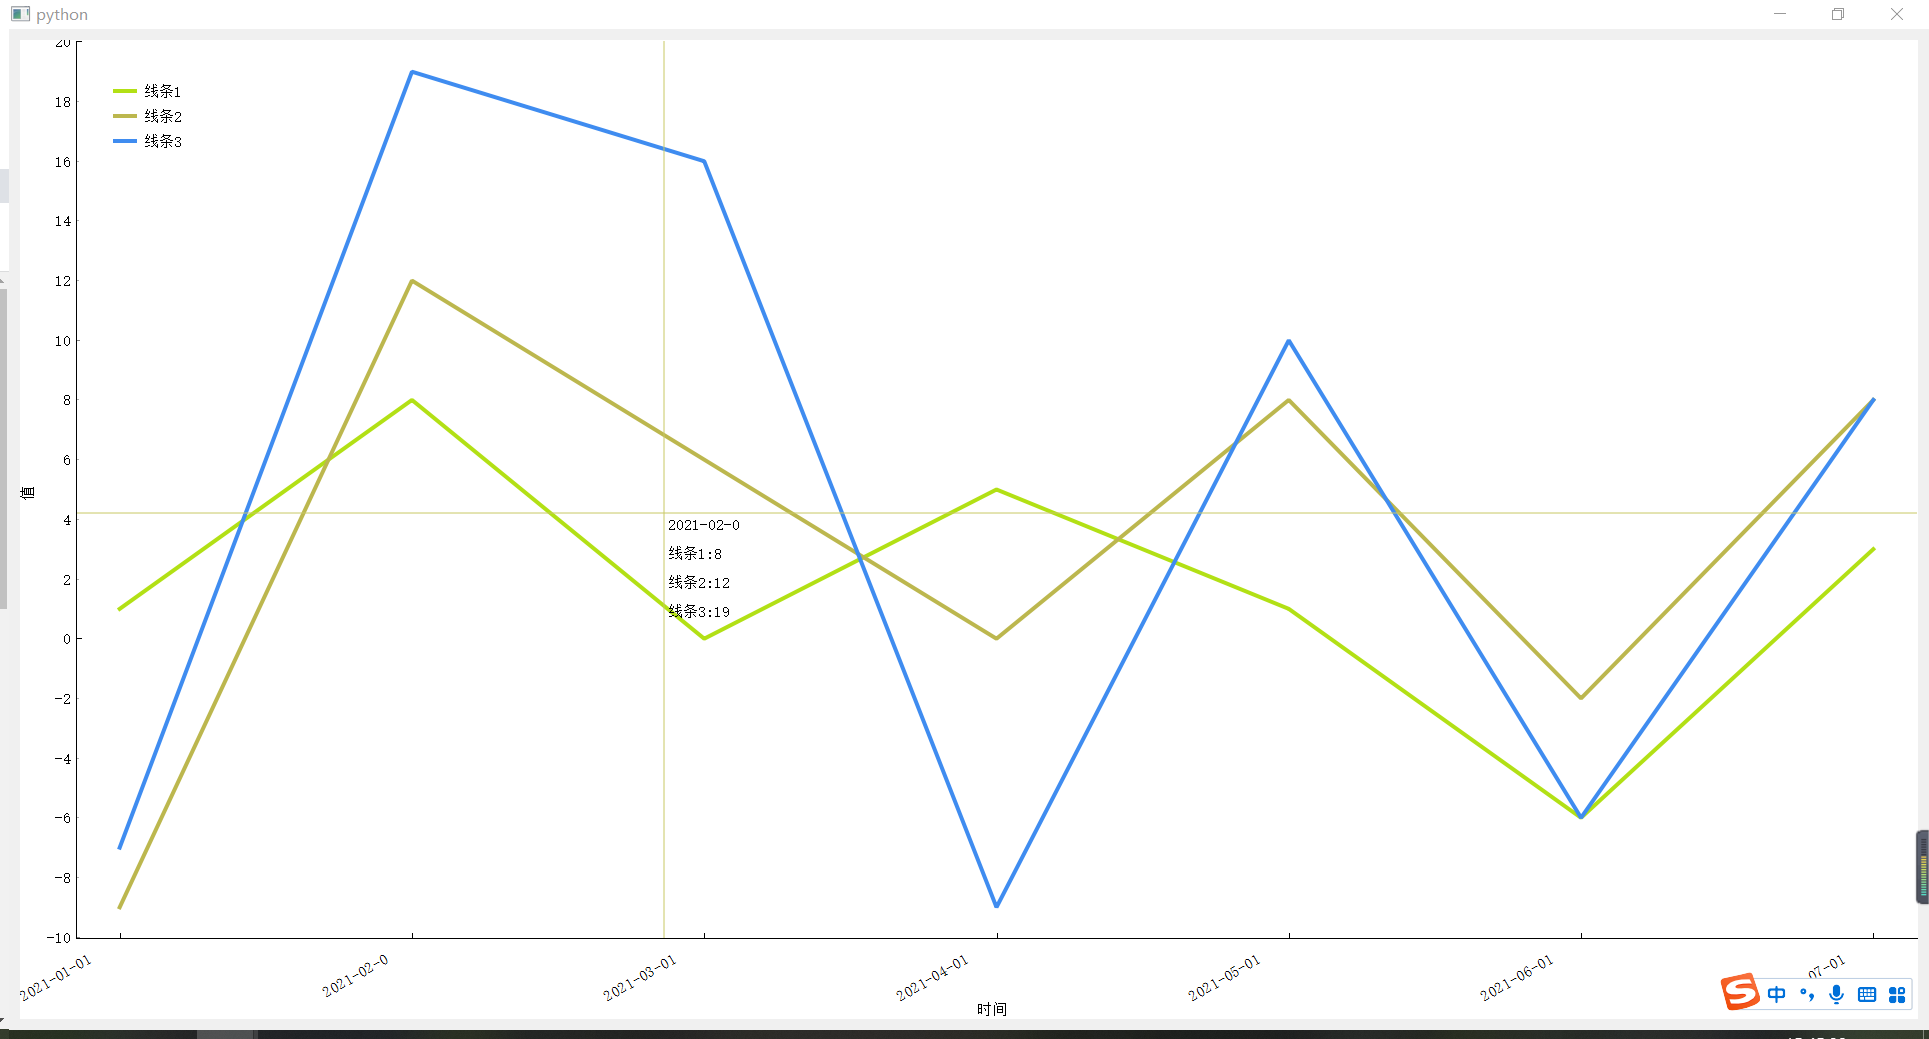
PYQT5 drawing Pyqtgraph multi-line diagram
Final rendering Code (can be copied directly to a .py file run, the effect after running is as shown above) Several attention points: 1. The abscissa string is too long to tilt, the implementation is ...

Pyqtgraph embedded in the interface that has been designed
Interface design The middle box is layout, which is to facilitate the positioning of Pyqtgraph. The UI is converted to .py file: test_ui.py 2. Add Pyqtgraph to Layout First previous code: main.py The ...
About Pyqtgraph draws a solution to embedded in the PYQT interface
Thanks to my big classmates, I solved this big problem. Article catalog Step diagram program Show (About the GUI production of PyQt, refer to the bloggersPortal) Step diagram program Then turn .ui to ...
OpenCV drawing radar PPI map is embedded in PYQT5 to achieve dynamic effects
Design the UI interface first, I put the picture drawn by OpenCV in Qlabel It's almost the same. Get a timer to achieve the cycle Draw the code code, the drawing function is the others,Link Explanatio...
(Detailed analysis) Based on PYQT5, Pyqtgraph and GLVIEWIDGET continuously update the location of the 3D scatter point graph, improve the number of refreshed frames, so that it has a fluttering effect
contents 1, problem description 2, solution 1, problem description Today, I received a private letter, and the results you want to update the location of how to dynamically update the point. The way h...
More Recommendation
[Python-pyqt5] How to clear the interface after removingWidget in pyqtgraph
It took a few hours to finally complete the removal of the original image, and found various methods! I thought it would not be displayed after the removeWidget was removed, but I found it was still &...
Pyqtgraph dynamic interaction and font format modification
Recently I wrote a test interface program for a Keithley source table. When you do data interactions, you have met some pits, including real-time dynamic display, graphic axis settings, font settings,...
7. Pyqtgraph timer refresh dynamic display waveform
This routine introduces how to refresh the PLOT waveform diagram through the timer. operation result: The actual operation is a moving picture, and the picture below is directly screenshot....
Pyqtgraph embedded in the PYQT interface to modify the proportion of PyQTGRAPH background color coordinate axis
Pyqtgraph embedded in the PYQT interface | Modify Pyqtgraph Background Color | Coordinate axis equivalence scale...
vtk embedded in the window of pyqt5
vtk is embedded in the window of pyqt5, Just run it, haven't learned vtk yet, and don't understand its function, The result of the operation found that the gap between the layout and the splitter is t...