D3 scale and coordinate axis
The d3 used in this article is the v5 version.
The scale can map data from "one interval" to "another interval".
E.g[0, 1]Corresponds to[0, 300], When 0.5 is input, 150 is output. Or will[0, 1, 2]Corresponds to["red", "green", "blue"], When 2 is input, blue is output.
In the above example[0, 1]with[0, 1, 2]CalledDomain,[0, 300]with["red", "green", "blue"]Calledrange. The mapping method between the domain and the value domain is calledCorrespondence law。
To understand the scale, you first need to understand the three concepts of domain, range and corresponding law.
Classification of scales
There are several types of scales: continuous scale, sequence scale, divergent scale, quantitative scale, quantile scale, threshold scale, ordinal scale, and segment scale.
①. Continuous Scales
Continuous scale is a type of scale, withContinuous quantitative domainMappingContinuous range, Specifically include: linear scale, exponential scale, logarithmic scale, quantitative constant scale, linear time scale, linear color scale.
There are several general methods for continuous scale:
continuousScale(x): Pass a value in the defined domain to the scale function, and return the corresponding value in the value domain. If the given x is not in the domain and clamping is not enabled, the corresponding value returned will also be outside the range, which is calculated by the mapping value.continuousScale.invert(y): Pass a value in the range to the invert method of the scale function, and return the corresponding value in the defined range. Reverse mapping is usually very useful in interaction, according to the position of the mouse to calculate the corresponding data range. If the given y is outside the range and clamping is not enabled, the corresponding value outside the domain will be calculated. This method is only useful when range is numeric. If range is not a numeric type, NaN is returned.continuousScale.domain( [numbers] ): Specify a numeric array as the domain of the current scale or get a copy of the domain of the current scale. The array contains two or more elements. If the elements in the given array are not numeric types, they will be forced to numeric types. . For continuous scale, the domain value array usually contains two values, but if you specify more than two values, a quantile scale will be generated.continuousScale.range( [values] ): Specify the value range of the current scale or get a copy of the value range of the current scale. The elements in the array do not have to be numeric types, but if you want to use invert, range must be specified as numeric types.continuousScale.rangeRound( [values] ): If used instead of range(), the output value of the scale will be rounded, and the result will be an integer.continuousScale.clamp( [boolean] ): The default is false, which means that when the scale receives a value that exceeds the defined range, a value can still be obtained according to the same calculation method. This value can be out of the range of the value range. When true, any value that exceeds the value range will be shrunk to the value range.continuousScale.interpolate( interpolate ): Set the value range interpolator of the scale. The interpolator function is used to interpolate between two adjacent values from the range.continuousScale.nice( [count] ): Extend the scope of the domain to a more ideal form. If the domain is[0.500000543, 0.899999931]When usingnice()Then you can change the domain to[ 0.5, 0.9 ]. applicationnice()After the method, the domain will become a more neat form, but not rounded.continuousScale.ticks( [count] ): By default, it returns an approximate array representing the domain of the scale. If the numeric parameter count is passed in, the scale will use count as a reference to calculate specific ticks based on the domain. When the count is not passed, the default count is 10.continuousScale.tickFormat( count[, format] ): Returns a function to adjust the elements of the ticks array. The elements of the ticks array are also called ticks. Note that the value of the parameter count should be consistent with the parameter in ticks. The optional format specifier allows developers to customize the format of ticks array elements, and the precision of the format will be automatically set after the definition, such as formatting a number as a percentage.continuousScale.copy(): Return a copy of the current scale. The returned copy and the current scale will not affect each other.
The following is an example of the general method of Continuous Scales, which is tested with linear scale as the method carrier:
// Linear scale
let xScale1 = d3.scaleLinear()
.domain( [1, 5] ) // Usually the domain in the continuous scale contains only two values, but if multiple values are specified, a quantile scale will be generated, for example, a quantile color scale will be created
.range( [0, 300] )
// .clamp( true )
console.log( xScale1(3) ); // 150
console.log( xScale1.invert(100) ); // 2.333333333333333
console.log( xScale1(-10) ); // -825, if clamp( true) is set, the return value is 0 at this time
console.log( xScale1(10) ); // 675, if clamp( true) is set, the return value is 300 at this time
// Create a linear quantile color scale. When the value of the scale function is 0.5, the returned value is the interpolation between white and green
let xScale2 = d3.scaleLinear()
.domain( [-1, 0, 1] )
.range( ["red", "white", "green"] )
console.log( xScale2(0.5) ); // rgb(128, 192, 128)
// Use ticks and tickFormat to personalize the representation of the scale definition threshold
let xScale3 = d3.scaleLinear()
.domain( [-1, 1] )
.range( [0, 960] )
let ticks = xScale3.ticks( 5 );
console.log( ticks ); // Return an approximate array used to represent the domain of the scale: [-1, -0.5, -0, 0.5, 1]
let tickFormatFn = xScale3.tickFormat( 5, "+" ); // Return the function used to format each item in the ticks array
let res = ticks.map( tickFormatFn ); // Format each element in the ticks array
console.log( res ); // ["-1", "-0.5", "+0", "+0.5", "+1"]
let tickFormatFn2 = xScale3.tickFormat( 5, "%" ); // Return the function used to format each item in the ticks array
let res2 = ticks.map( tickFormatFn2 ); // Format each element in the ticks array
console.log( res2 ); // ["-100%", "-50%", "0%", "50%", "100%"]
let tickFormatFn3 = xScale3.tickFormat( 5 ); // When the second parameter is not passed as a specifier, each element of the ticks array will not be customized
let res3 = ticks.map( tickFormatFn3 ); // Format each element in the ticks array
console.log( res3 ); // ["-1.0", "-0.5", "0.0", "0.5", "1.0"]
a. Linear scale
The method of creating a linear scale isd3.scaleLiner(). The default domain is[0, 1], The default range is[0, 1], The interpolator method is called by defaultinterpolator, The clamp method is flase by default. It is a good scale that supports continuous quantification. Each value y in the range can be expressed as a function:y = mx + b, Where x is the value in the corresponding domain.
b. Exponential scale (power scale), log scale (log scale)
Index scale:d3.scalePow(), The default domain is[0, 1], The default range is[0, 1], The default exponent is 1, and the interpolator method is called by defaultinterpolator, The clamp method is flase by default. Similar to a linear scale, the difference is that exponential transformation is applied to the value of the defined domain before calculating the output value domain. Each output value y can be expressed as a function of x:y = mx^k + b. Compared with the ordinary continuous scale, the exponential scale has one more method:pow.exponent( [exponent] ), Used to specify or get the index of the index scale. When the index is 1, it has the same effect as the linear scale.
// Define the exponent scale. When exponent is not defined, the default exponent is 1, and the effect is the same as the linear scale.
let xScale4 = d3.scalePow()   // The default domain is [0, 1], and the value range is [0, 1]
                // .exponent( 2 )
console.log( xScale4(2) );  // 2

// If a numeric parameter is passed to exponent() of the exponent scale, it will be calculated according to the exponent calculation rule
xScale4.exponent(2);  // The index is 2
console.log( xScale4(2) );    // 4
xScale4.exponent(0.5);  // The index is 0.5, in fact, it is to find the square root, and the d3.scaleSqrt() method can be used to find the square root
console.log( xScale4(2) );    // 1.4142135623730951
Log scale:d3.scaleLog(), The default domain is[0, 1], The default range is[0, 1], The default base is 10, the way to specify the base islog.base([base]), The interpolator method is called by defaultinterpolator, The clamp method is flase by default. Similar to a linear scale, except that the input value is logarithmic converted before the output value is calculated. The corresponding y value can be expressed as a function of x: y = m log(x) + b.
c. Identical scale
Identical scale is a special case of linear scale, and its domain and range are completely consistent. The method to create a constant scale is:d3.scaleIdentity()。
d. Time scale
The time scale is a variant of the linear scale. Its input is forced to be a date type instead of a numeric type, and invert returns a date type. The time scale is based on calendar intervals to implement ticks. The way to create a time scale is:d3.scaleTime()
// Time scale
let xScale5 = d3.scaleTime()
                .domain( [new Date(2000, 0, 1), new Date(2000, 0, 2)] )
                .range( [0, 960] )
console.log( xScale5( new Date(2000, 0, 1, 5) ) );    // 200
console.log( xScale5( new Date(2000, 0, 1, 16) ) );   // 640
console.log( xScale5.invert( 200 ) );   // Sat Jan 01 2000 05:00:00 GMT+0800 (China Standard Time)
console.log( xScale5.invert( 640 ) );   // Sat Jan 01 2000 16:00:00 GMT+0800 (China Standard Time)
②. Sequence scale
The sequence scale is similar to the continuous scale, and it also maps the continuous domain to the continuous range. But unlike the continuous scale, the value range of the serial scale is built-in according to the specified interpolator and is not configurable, and its interpolation method is also not configurable. No serial scaleInvert、Range、Range round、Interpolatemethod.
have toUse the specified interpolate functionTo create a sequence scale byd3.scaleSequential(interpolate). noteThe domain value of the sequence scale must be a numeric value and only contain two values。
When applying the sequence scale, the value that can be passed in is [0, 1]. Where 0 is the minimum value and 1 is the maximum value.
// sequence scale
// Implement a HSL color interpolator with periodicity
let xScale6 = d3.scaleSequential( function( t ){
  return d3.hsl( t*360, 1, 0.5 ) + "";
} )
console.log( xScale6(0) );    // rgb(255, 0, 0)
console.log( xScale6(0.8) );  // rgb(204, 0, 255)
console.log( xScale6(1) );    // rgb(255, 0, 0)

// Use d3.interpolateRainbow to implement a more elegant and efficient periodic color interpolator
let xScale7 = d3.scaleSequential( d3.interpolateRainbow )
console.log( xScale7(0) );    // rgb(110, 64, 170)
console.log( xScale7(0.5) );    // rgb(175, 240, 91)
console.log( xScale7(1) );    // rgb(110, 64, 170)
③. Divergence scale
The divergent scale is similar to the sequence scale and the continuous scale, and it also maps a continuous domain to a continuous value domain. But the difference is that the output of the divergence scale is calculated based on the interpolator and is not configurable. Same noInvert、Range、Range round、Interpolatemethod.
have toUse the specified interpolate functionTo create a divergent scale byd3.scaleDiverging(interpolate)。
When applying the divergence scale, the interpolator will calculate the corresponding output value based on the input value in the range [0, 1], where 0 represents the negative minimum value, 0.5 represents the median value, and 1 represents the positive maximum value. For example, use d3.interpolateSpectral:var spectral = d3.scaleDiverging(d3.interpolateSpectral);。
④. quantize scale
The quantization scale is similar to the linear scale, and its domain is continuous, but the value domain is discrete, and the continuous domain values will be divided into uniform segments.
For example: the domain is[0, 10], The value range is["red", "green", "blue", "yellow", "black"]. After using the quantitative scale, the domain of definition will be divided into 5 segments, each corresponding to a value in the range. [0, 2) corresponds to red, [2, 4) corresponds to green, and so on. Therefore, the quantization scale is suitable for the scene of "value corresponding to color". For example, the GDP of each province in China, the larger the value, the darker the color.
The method of creating a quantitative scale isd3.scaleQuantize(), The default domain is [0, 1], the default value domain is [0, 1], the quantization scale created by default is equivalent toMath.roundfunction. The Math.round() function returns the nearest integer after rounding a number.
There are several application scenarios for quantitative scale:
// Quantitative scale
let xScale8 = d3.scaleQuantize()
.domain( [0, 1] )
.range( [ "brown", "steelblue" ] )
console.log( xScale8( 0.49 ) ); // brown
console.log( xScale8( 0.51 ) ); // steelblue
// Divide the input field into three segments of equal size and different range values to calculate the appropriate stroke width:
let xScale9 = d3.scaleQuantize()
.domain( [10, 100] )
.range( [1, 2, 4] )
console.log( xScale9(20) ); // 1
console.log( xScale9(50) ); // 2
console.log( xScale9(80) ); // 4
// Calculate the range of values in the corresponding domain according to the values in the specified value range [x0, x1]. This method is useful for interaction, such as inferring the range of the domain based on the value corresponding to the mouse pixel.
let xScale10 = d3.scaleQuantize()
.domain( [10, 100] )
.range( [1, 2, 4] )
console.log( xScale10.invertExtent( 2 ) ); // [40, 70]
Here is an example of the coordinate axis of the quantitative scale. There are several circles. The smaller the radius of the circle, the darker the color:
// Define the quantitative scale
let quantizeScale = d3.scaleQuantize()
                      .domain( [ 0, 50 ] )
                      .range( ["#888", "#666", "#444", "#222", "#000"] );

// Define the radius of the circle
let r = [ 45, 35, 25, 15, 5 ];

console.log( quantizeScale( 29 ) );     // #444 Query the value of the range by defining the range value
console.log( quantizeScale.invertExtent( "#222" ) );    // [30, 40] Back-check the domain range by specifying the range value

// Add svg element to body
let svg = d3.select( "body" )
            .append( "svg" )
            .attr( "width", 500 )
            .attr( "height", 400 )

let circle = svg.selectAll( "circle" )
                .data( r )
                .enter()
                .append( "circle" )
                .attr( "cx", function( d, i ){ return 50 + i * 100 } )
                .attr( "cy", 50 )
                .attr( "r", function( d ){ return d } )
                .attr( "fill", function(d){ return quantizeScale(d) } )
Effect screenshot:


⑤. quantile scale (quantile scale)
⑥. Threshold scale
⑦. Ordinal scale
a. Ordinal scale
Unlike continuous scales, the domain and value range of ordinal scales are both discrete. In actual scenarios, there may be a need to obtain other discrete values such as color titles based on names, serial numbers, etc. At this time, the ordinal scale must be considered.
The method of creating ordinal scale is:d3.scaleOrdinal([range])。
Construct an ordinal scale using the empty domain and the specified value domain. If the value range is not specified, it will default to an empty array. The ordinal scale always returns undefined before defining a non-empty domain.
b. Segmented scale
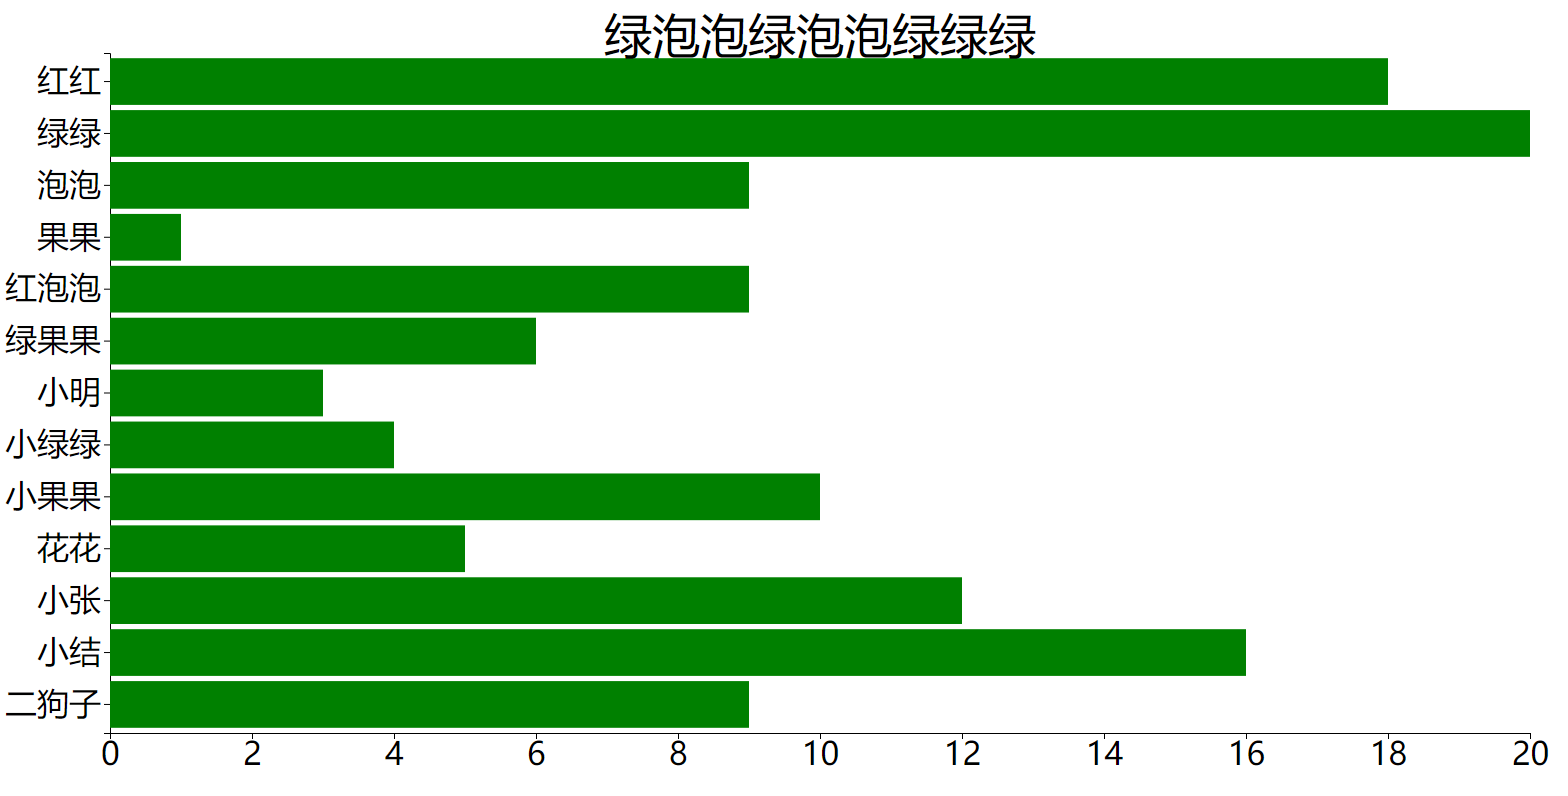
The segmented scale is similar to the ordinal scale. The difference is that the domain of the segmented scale can be a continuous numeric type, while the discrete value domain divides the continuous domain into uniform segments. Segmentation is often used for bar charts that contain ordinal or categorical dimensions.
The method to create a segmented scale is:d3.scaleBand()。
Finally, make a summary of each scale:
- Continuous scales (including linear scales, exponential scales, logarithmic scales, constant scales, time scales), serial scales, and divergent scales all map continuous domains to continuous value domains;
- The quantitative scale is to map a continuous domain to a discrete value domain;
- Quantile scale is to map a discrete domain to a discrete value domain;
- Ordinal scale is to map a discrete domain to a discrete value domain;
- Segmented scale is to map a discrete domain to a discrete value domain;
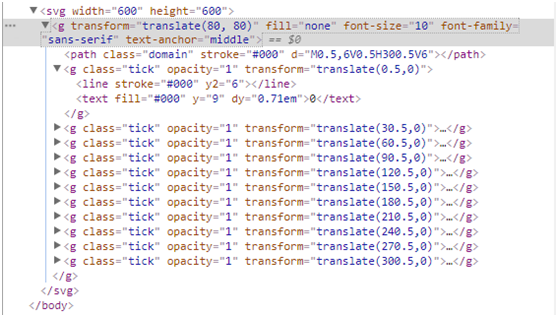
Axis
The following is an example of histogram code with coordinate axes:
import * as d3 from "d3";

// Histogram data
let dataset = [ 20, 43, 120, 87, 99, 167, 142 ];

// Define the width and height of the svg
let width = 600, height= 600;

// Define the SVG canvas
let svg = d3.select( "body" )   // select the body element
            .append( "svg" )    // Add svg element
            .attr( "width", width )     // Define the width of the svg canvas
            .attr( "height", height )   // Define the height of the svg canvas
            .style( "background-color", "#e5e5e5" )

// Define svg inner margin
let padding = { top: 50, right: 50, bottom: 50, left: 50 };

// gap between rectangles
let rectPadding = 20;

// Define a linear scale for the X axis
let xScale = d3.scaleBand()
               .domain( d3.range(dataset.length) )
               .rangeRound( [0, width-padding.left-padding.right] )
// Use the given xScale to construct an X coordinate axis with the scale below
let xAxis = d3.axisBottom( xScale );

// Define a y-axis linear scale for the coordinate axis
let yScale = d3.scaleLinear()
               .domain( [0, d3.max( dataset )] )
               .range( [height-padding.top-padding.bottom, 0 ] )
               .nice()
// Use the given yScale to construct a y-coordinate axis with the scale on the left
let yAxis = d3.axisLeft( yScale )

// Place the X axis at a specific position in the svg canvas
svg.append( "g" )
   .attr( "transform", "translate( "+ padding.left +", "+ (height - padding.bottom) +" )" )
   .call( xAxis )

// Place the Y axis at a specific position in the svg canvas
svg.append( "g" )
   .attr( "transform", "translate( "+ padding.left +", "+ padding.top +" )" )
   .call( yAxis )

// Generate the corresponding columnar rectangle according to the data
let rect = svg.append( "g" )
          .selectAll( "rect" )  // Get empty selection set
          .data( dataset )  // bind data
          .enter()      // Get the enter part, because there is actually no rect element on the page at this time, and the empty selection set is obtained. At this time, you must operate on the enter part
          .append( "rect" ) // Insert the corresponding number of rect elements according to the number of data
          .attr( "fill", "#377ade" )
          .attr( "x", function( d, i ){     // Set the x coordinate of each columnar rectangle, which is the left inner margin + the value of the value range corresponding to the X-axis domain value + the rectangular gap
            return padding.left + xScale(i) + rectPadding/2;
          } )
          .attr( "y", function( d, i ){     // Set the y coordinate of each columnar rectangle
            return yScale(d) + padding.top;
          } )
          .attr( "width", xScale.step()-rectPadding )   // Set the width of each columnar rectangle
          .attr( "height", function( d, i ){   // Set the height of each columnar rectangle, svg height-upper and lower inner margin-the value of the value range corresponding to the Y-axis domain value
            return height-padding.bottom-padding.top-yScale(d);
          } )


// 3. Add label text to each columnar rectangle
let text = svg.append( "g" )
              .selectAll( "text" )  // Get empty selection set
              .data( dataset )      // bind data
              .enter()              // Get the enter part
              .append( "text" )     // Add the corresponding text element for each data
              .attr( "fill", "#fff" )
              .attr( "font-size", "14px" )
              .attr( "text-anchor", "middle" )  // Text anchor attribute, aligned in the middle
              .attr( "x", function( d, i ){
                return xScale.step()/2 + xScale(i);
              } )
              .attr( "y", function( d, i ){
                return yScale(d) + padding.top;
              } )
              .attr( "dx", xScale.step()-rectPadding )
              .attr( "dy", "1em" )
              .text( function( d ){
                return d;
              } )
Effect screenshot:

The following is an example of scatter chart code with coordinate axes:
import * as d3 from "d3";

// Define the center coordinate array, the first item of each sub-array in the array represents the x value of the center of the circle, and the second item represents the y value of the center of the circle
let center = [
    [0.5, 0.5],
    [0.7, 0.8],
    [0.4, 0.9],
    [0.11, 0.32],
    [0.88, 0.25],
    [0.75, 0.12],
    [0.5, 0.1],
    [0.2, 0.3],
    [0.4, 0.1],
    [0.6, 0.7],
 ]

// Define the width and height of the svg
let width = 700, height = 600;
// Define svg inner margin
let padding = { top: 50, right: 50, bottom: 50, left: 50 };

// Define svg and insert g element
let gs = d3.select( "body" )
           .append( "svg" )
           .attr( "width", width )
           .attr( "height", height )
           .style( 'background-color', "#e5e5e5" )
           .append( "g" )

// Define the x-axis scale. When setting the domain, first take out the first item (d[0]) of each sub-array of the center array to form a new array, and then use d3.max to find the maximum value. Finally, the maximum value is multiplied by 1.2. This is to prevent a certain point of the scatter chart from being on the edge of the x-axis.
let xScale = d3.scaleLinear()
               .domain( [0, 1.2*d3.max( center, function(d){ return d[0] } )] )
               .range( [0, width-padding.left-padding.right] )
               .nice()
// Create an x-axis with the scale below
let xAxis = d3.axisBottom( xScale );

// Define the y-axis scale. When setting the domain, first take out the second item (d[1]) of each sub-array of the center array to form a new array, and then use d3.max to find the maximum value. Finally, the maximum value is multiplied by 1.2. This is to prevent a certain point of the scatter plot from being on the edge of the y coordinate axis.
let yScale = d3.scaleLinear()
               .domain( [0, 1.2*d3.max( center, function(d){ return d[1] } )] )
               .range( [height-padding.top-padding.bottom, 0] )
               .nice()
// Create a y coordinate axis with scale on the right
let yAxis = d3.axisLeft( yScale );

// Insert the x coordinate axis wrapped by the g element in the svg
gs.append( "g" )
  .attr( "transform", "translate( "+ padding.left +", "+ (height-padding.bottom) +" )" )
  .call( xAxis )
// Insert the y coordinate axis wrapped by the g element in the svg
gs.append( "g" )
  .attr( "transform", "translate( "+ padding.left +", "+ padding.top +" )" )
  .call( yAxis )

// Insert a scatter circle wrapped by the g element in the svg
gs.append( "g" )
  .selectAll( 'circle' )
  .data( center )
  .enter()
  .append( "circle" )
  .attr( "fill", "black" )
  .attr( "cx", function( d ){
    return padding.left + xScale(d[0]);
  } )
  .attr( "cy", function( d ){
    return padding.top + yScale(d[1]);
  } )
  .attr( "r", 5 )

// Insert coordinate text wrapped by g element in svg
gs.append( "g" )
  .selectAll( "text" )
  .data( center )
  .enter()
  .append( "text" )
  .attr( "fill", "#999" )
  .attr( "font-size", "12px" )
  .attr( "text-anchor", "middle" )
  .attr( "x", function( d, i ){
    return padding.left + xScale(d[0]);
  } )
  .attr( "y", function( d, i ){
    return padding.top + yScale(d[1]);
  } )
  .attr( "dy", "-1em" )
  .text( function(d){
    return "[" + d[0] + " : " + d[1] + "]";
  } )
Effect screenshot:

Intelligent Recommendation
D3.JS coordinate axis setting
Common code: First, define the coordinate axis D3.Svg.axis (): The components of the coordinate axis in D3 can generate an element that constitutes a coordinate axis in the SVG. Scale (): Specifies th...
V3 version of D3.js-used in Vue framework (Chapter 3) --- Scale bar and coordinate axis
1. Scale Four commonly used scales are recorded here: linear, ordinal, ordinal segment, time scale, others will be updated later or viewed on their official website d3.scaleLinear() d3.scaleOrdinal() ...
Draw coordinate axis and coordinate axis scale with C#
Draw coordinate axis and coordinate axis scale with C#...
D3.js learning summary (four)-coordinate axis
Axis is the visual display of the scale on the interface, so the axis must be bound to a scale. d3.js provides ready-made grammar codes, which can easily draw coordinate extraction. as follows: Define...
d3.js histogram and coordinate axis basis
d3.js histogram and coordinate axis basis LSD_Monkey Here's how to use d3.js, input a data list, and draw a simple histogram with coordinate axes based on the data. The following is the target effect....
More Recommendation

Visualization tool-D3-use of coordinate axis
As a component of a visual chart, the coordinate axis plays a very important role. d3.js defines the axis drawing method (personal translation, please understand if there is an error): • d3.axisT...
D3.js Control SVG, Coordinate axis (02)
Foreword: This main content is SVG control. Use D3 to get, modify, delete nodes (primitives), scale, using D3 to draw simple column charts, introduce the coordinate axis. First, use D3 to query SVG 1....
Painting coordinate axis with D3 line segment
code show as below: The results shown are shown below: 2. Score The results shown are shown below:...
MATPLOTLIB drawing removes coordinate axis and coordinate axis scale
** Note: ** These three lines of code should be placed before plt.show (), and then PLT.IMSHOW ()...
Matlab changes the scale and size of the coordinate axis
Take the x-axis as an example. limits the range of the x-axis: Name the x-axis scale Custom x-axis scale interval If you need to define the names of these scales, you can use xticklabels Name the x-ax...