Qcustomplot realizes the function of mouse click to obtain curve value
This function is a bit similar to the function of Matlab data cursor. The blogger himself did not find a method for Qt's own packaging, so search for information on the Internet and implement this function according to the current method.

In the header file we need to pay attentionQCustomplot、QCPItemText、QCPItemTracerOf these three classes, the last two classes are new components developed on the QCustomplot class. The first class is the drawing class we need to use. It needs to include the .h and .cpp files. At the same time, modify the pro file to use it. The second class is used to display the coordinates of our text, and the third class is equivalent to an anchor point to locate the point we clicked. Regarding the specific instructions of this type of writing, there is an official document introduction. Here are some references for your reference. The description of the official document is as follows:
QCustomPlot allows placing and anchoring of graphical elements such as text, arrows, lines, rectangles, arbitrary pixmaps etc. on the plot. They are based on the abstract base class QCPAbstractItem. A detailed description of the item mechanism and what built-in items are currently available can be found in the documentation of QCPAbstractItem.
QCustomPlot allows to place and anchor graphic elements on the drawing, such as text, arrows, lines, rectangles, arbitrary pixel maps, etc. They are based on the abstract base class QCPAbstractItem. A detailed description of the project mechanism and currently available built-in projects can be found in the QCPAbstractItem documentation.
Original link:https://www.qcustomplot.com/index.php/tutorials/items
head File
We inherited a subclass of QWidget and private the several instances mentioned above, and then used it. QCustomplot drawing requires the QVctor. Note here that the Vector must be stored in dobule. Among them, we affirmed two slot functions, one is used to receive drawing data, the other is used to respond to mouse click response events.
#ifndef CHARTWIDGET_H
#define CHARTWIDGET_H

#include <QWidget>
#include <QGroupBox>
#include <QGridLayout>


class ChartWidget : public QWidget
{
    Q_OBJECT
public:
    ChartWidget(QWidget *parent = 0);
    ~ChartWidget();
private slots:
    void SLOT_PlotData(char *,uint16_t);
         void SLOT_mouseTracetoCoord(QMouseEvent *event);//Slot function triggered by mouse press, explained later

private:
    QCustomPlot *m_RcustomPlot = nullptr;

         QCPItemText *m_currentLabel;//Text box showing coordinates
         QCPItemTracer *m_tracer;//A mark of anchor

         QVector<double> m_VData;//store data
         QVector<double> m_DataSize;//The subscript to store the data
};
Cpp file
We configure our members in the constructor. Here we create a new GroupBox, put our QCustomplot into this Box, and configure the properties of the two widgets.
ChartWidget::ChartWidget(QWidget *parent):QWidget(parent)
{
    m_RcustomPlot = new QCustomPlot();
    m_RcustomPlot->addGraph();
         m_RcustomPlot->graph(0)->setPen(QPen(Qt::blue));//Real part

         //Automatically set the range of the display interface
    m_RcustomPlot->graph(0)->rescaleAxes();
         //Set the zoom of drawing output image interface
    m_RcustomPlot->setInteractions(QCP::iRangeDrag | QCP::iRangeZoom );

         //x axis parameter configuration
         m_RcustomPlot->xAxis->setBasePen(QPen(Qt::black)); //Base line
         m_RcustomPlot->xAxis->setTickPen(QPen(Qt::black)); //scale
         m_RcustomPlot->xAxis->grid()->setVisible(true); //Grid lines are visible
         m_RcustomPlot->xAxis->grid()->setPen(QPen(QColor(130, 130, 130), 0, Qt::DotLine)); //Grid line color and line style
         m_RcustomPlot->xAxis->setTickLabelColor(Qt::black); //x-axis tick mark text color
         m_RcustomPlot->xAxis->setLabelColor(Qt::black); //x-axis label color
         m_RcustomPlot->xAxis->setLabel("distance gate"); //x axis label value

         //y-axis parameter configuration
    m_RcustomPlot->yAxis->setBasePen(QPen(Qt::black));
    m_RcustomPlot->yAxis->setTickPen(QPen(Qt::black));
    m_RcustomPlot->yAxis->grid()->setVisible(true);
    m_RcustomPlot->yAxis->grid()->setPen(QPen(QColor(130, 130, 130), 0, Qt::DotLine));
    m_RcustomPlot->yAxis->setTickLabelColor(Qt::black);
    m_RcustomPlot->yAxis->setLabelColor(Qt::black);
         m_RcustomPlot->yAxis->setLabel("Signal amplitude");

         QGroupBox *gbox_Real = new QGroupBox();//Put the instantiated QCustomplot into QGroupbox
         gbox_Real->setStyleSheet("background:white");//Set the background color

         QVBoxLayout *gbox_Real_layout = new QVBoxLayout();//Build the layout
    gbox_Real->setLayout(gbox_Real_layout);
    gbox_Real_layout->addWidget(m_RcustomPlot);

    connect(this->m_RcustomPlot,SIGNAL(mousePress(QMouseEvent *)),this,SLOT(SLOT_mouseTracetoCoord(QMouseEvent *)));

         //Attribute configuration of widget
         m_tracer = new QCPItemTracer(this->m_RcustomPlot);//Set the parent class of the widget
         m_tracer->setStyle(QCPItemTracer::tsCircle);//The type of anchor point is set to circle
         m_tracer->setPen(QPen(Qt::red, 1, Qt::DashLine));//brush type
    m_tracer->setBrush(Qt::NoBrush);

         m_currentLabel = new QCPItemText(this->m_RcustomPlot);//Text box parent class setting
    m_currentLabel->setLayer("overlay");
    m_currentLabel->setClipToAxisRect(false);
    m_currentLabel->setPadding(QMargins(3,3,3,3));
    m_currentLabel->setPen(QPen(QColor(130, 130, 130), 0, Qt::DotLine));
    m_currentLabel->setBrush(Qt::NoBrush);
         m_currentLabel->position->setParentAnchor(m_tracerR->position);//The display position follows the position of the anchor point
    m_currentLabel->setFont(QFont("Arial",8));
    m_currentLabel->setColor(Qt::red);


         m_tracer->position->setTypeX(QCPItemPosition::ptPlotCoords);//Display on the curve
    m_tracer->position->setTypeY(QCPItemPosition::ptPlotCoords);
    m_tracer->setSize(5);

    m_currentLabel->setPositionAlignment(Qt::AlignLeft | Qt::AlignVCenter);

    m_currentLabel->setVisible(false);
    m_tracer->setVisible(false);
}
Here is the core of the entire code segment. The slot function mentioned above is used to respond to mouse click events. Here, the obtained mouse coordinates are converted into the x-axis and y-axis coordinates corresponding to the customplot. value.
Because my data is discrete points, I need to observe the amplitude of these discrete points, so I will judge the coordinates after the mouse click to see the difference between the value and the x and y values in my data. If the value is small enough, I think that a data point in the data set has been selected, and then I choose to display the point in text.
Since we will zoom in and out on the page of customplot, due to the previous configuration, the xy axis here should change accordingly, so the display range of the coordinate axis will also change, in order to better adapt our functions , So I will first get the range of the x and y axes, and divide it by a scale factor I tried to avoid the problem that the mouse clicks on the point but displays the wrong point.
There is also a simple implementation using Qtooltip. I can't control the display time of this implementation, so I didn't use it.
After doing the above operations,Be sure to remember the call of the replot function. Only by calling this sentence will the content in your code be redrawn and displayed.
void ChartWidget::SLOT_mouseTracetoCoord(QMouseEvent *event)
{
    //Get mouse coordinates
    QPointF ChickedPoint = event->pos();
    m_currentLabel->setVisible(false);
    m_tracer->setVisible(false);
         //Exclude points outside the interval
    if(this->m_RcustomPlot->viewport().contains(event->pos()))
    {
                 //The position after the mouse click is converted to the corresponding coordinate of the lower axis
        int16_t current_Rx = this->m_RcustomPlot->xAxis->pixelToCoord(ChickedPoint.x());
        int16_t current_Ry = this->m_RcustomPlot->yAxis->pixelToCoord(ChickedPoint.y());

                 //Get the real y-axis display range
        double y_range = (this->m_RcustomPlot->yAxis->range().size()) / 100;
        double x_range = (this->m_RcustomPlot->xAxis->range().size()) / 50;

        if(!m_VDataReal.empty())
        {
                         for(int i = 0; i != m_VDataReal.size(); i++)//Iterate over my data set
            {
                if((abs(current_Ry - m_VDataReal.at(i)) <= y_range) && (abs(current_Rx - m_DataSize.at(i)) <= x_range))
                {
                                         //QToolTip output value
 #if 0 //Simplified version of value observation The mouse arrow can easily block the label
                    QToolTip::showText(mapToGlobal(event->pos()),QString("%1 ,%2 ").arg(current_x).arg(current_y),this/*,QRectF(QPointF(15,15),QPointF(15,15))*/);
#else
                    m_currentLabel->setVisible(true);
                    m_tracer->setVisible(true);
                    this->m_tracer->position->setCoords(m_DataSize.at(i),m_VDataReal.at(i));
                                         this->m_currentLabel->position->setCoords(0,-10);//Offset the label drawing position upward
                    this->m_currentLabel->setText(QString("%1 ,%2 ").arg(current_Rx).arg(current_Ry));

                    break;
#endif
                }

            }
            this->m_RcustomPlot->replot();
        }
    }

    else return;

}
At last
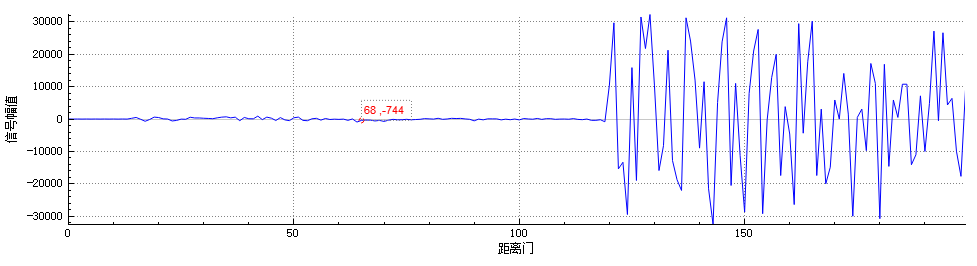
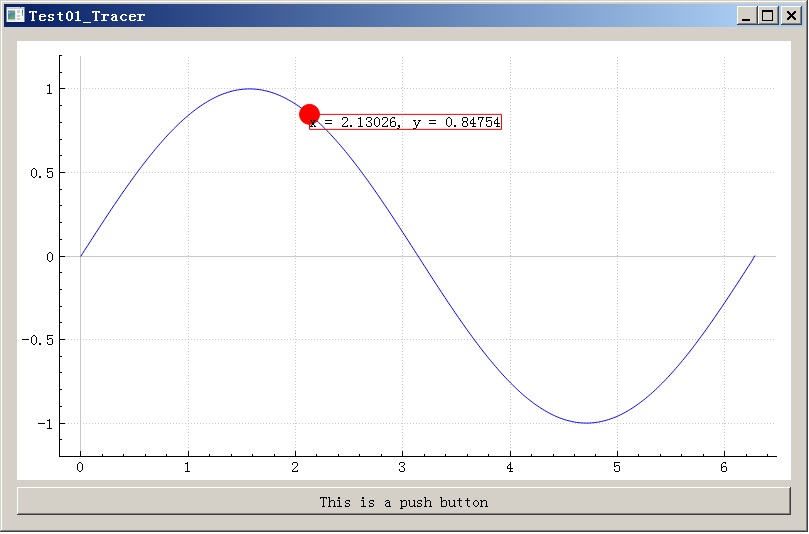
Let's take a look at the renderings. The code is part of the project I extracted. It may not be able to be compiled directly. Here is an idea. If you have time in the future, you can change it to executable code. The red dot in the picture is our anchor point, and the dashed box is our text box
Intelligent Recommendation
QCustomPlot series (7)-The cursor can follow the mouse to display the coordinate value (that is: the cross cursor function) to absorb the sampling point
Let's take a look at the effect: The functions implemented in this animation are: 1. The X value of the crosshair cursor follows the mouse, but the Y value does not follow. 2. The Y value of th...
RDLC report uses the method of drilling to obtain the value of the mouse click
In actual applications, sometimes the mouse is used to click on an item in the report, and then the corresponding interface pops up, the effect is as follows: This effect is still not easy to do in RD...
Method for setting cursor that can move with mouse on data curve using QCustomPlot
QCustomPlot (hereinafter referred to as QCP) is definitely a welfare tool for drawing data curves when using Qt development. A few lines of code can draw 2D data curves well. But sometimes there are s...
QT5 QCUSTPLOT realizes dynamic curve drawing. You can zoom in on the left, right -click, and display coordinates with the mouse
QT5 QCUSTPLOT realizes dynamic curve drawing 1. Preparation Download file, official website: https://www.qcustomPlot.com/ According to the official website tutorial, QT adds help files. git or github ...

Weijingxing Citymaker pipe gallery 3D Gis realizes mouse click function
Using C# to implement the click function on the Citymaker 3D Gis platform The effect is as follows(Technical exchange can be added group: 161154103) First set the mouse to click selection state, the c...
More Recommendation
Set the ZedGraph mouse double click in Winform to get the coordinate value of the point on the nearest curve
Scenes Set the ZedGraph focus display coordinate formatting in WInforn and the solution to display three coordinate numbers: Realize multiple Y-axes of ZedGraph in Winform (source download attached): ...

Qcustomplot sets the curve style
1. Set the curve style Function: setLineStyle (LineStyle ls) Usage:Customplot->graph()->setLineStyle((QCPGraph::lsStepLeft)); The various styles are shown in the figure: 2. Set the style of the ...
The parameter curve of QCustomPlot (7)
Article Directory Use of parametric equations QCPCurveUsed to draw parametric equation curves, the common parametric equations are as follows: QCPCurveversusQCPGraphThe difference is that it introduce...
QCustomPlot on the smooth curve (eight)
Article Directory 1. Generate a smooth curve 2. Modification of drawLinePlot function In QCustomPlot, it does not provide us with a smooth curve, so we need to modify it Note: modification needs to mo...
QCustomPlot: Filling of curve data
Post here firstOfficial website example: The above is a data filling scheme using curves, it is best not to use setData and addData The following are some of the experience used, " rel="nofo...