Python Learning 1-K-Means cluster
Reference blog post:
My preparation
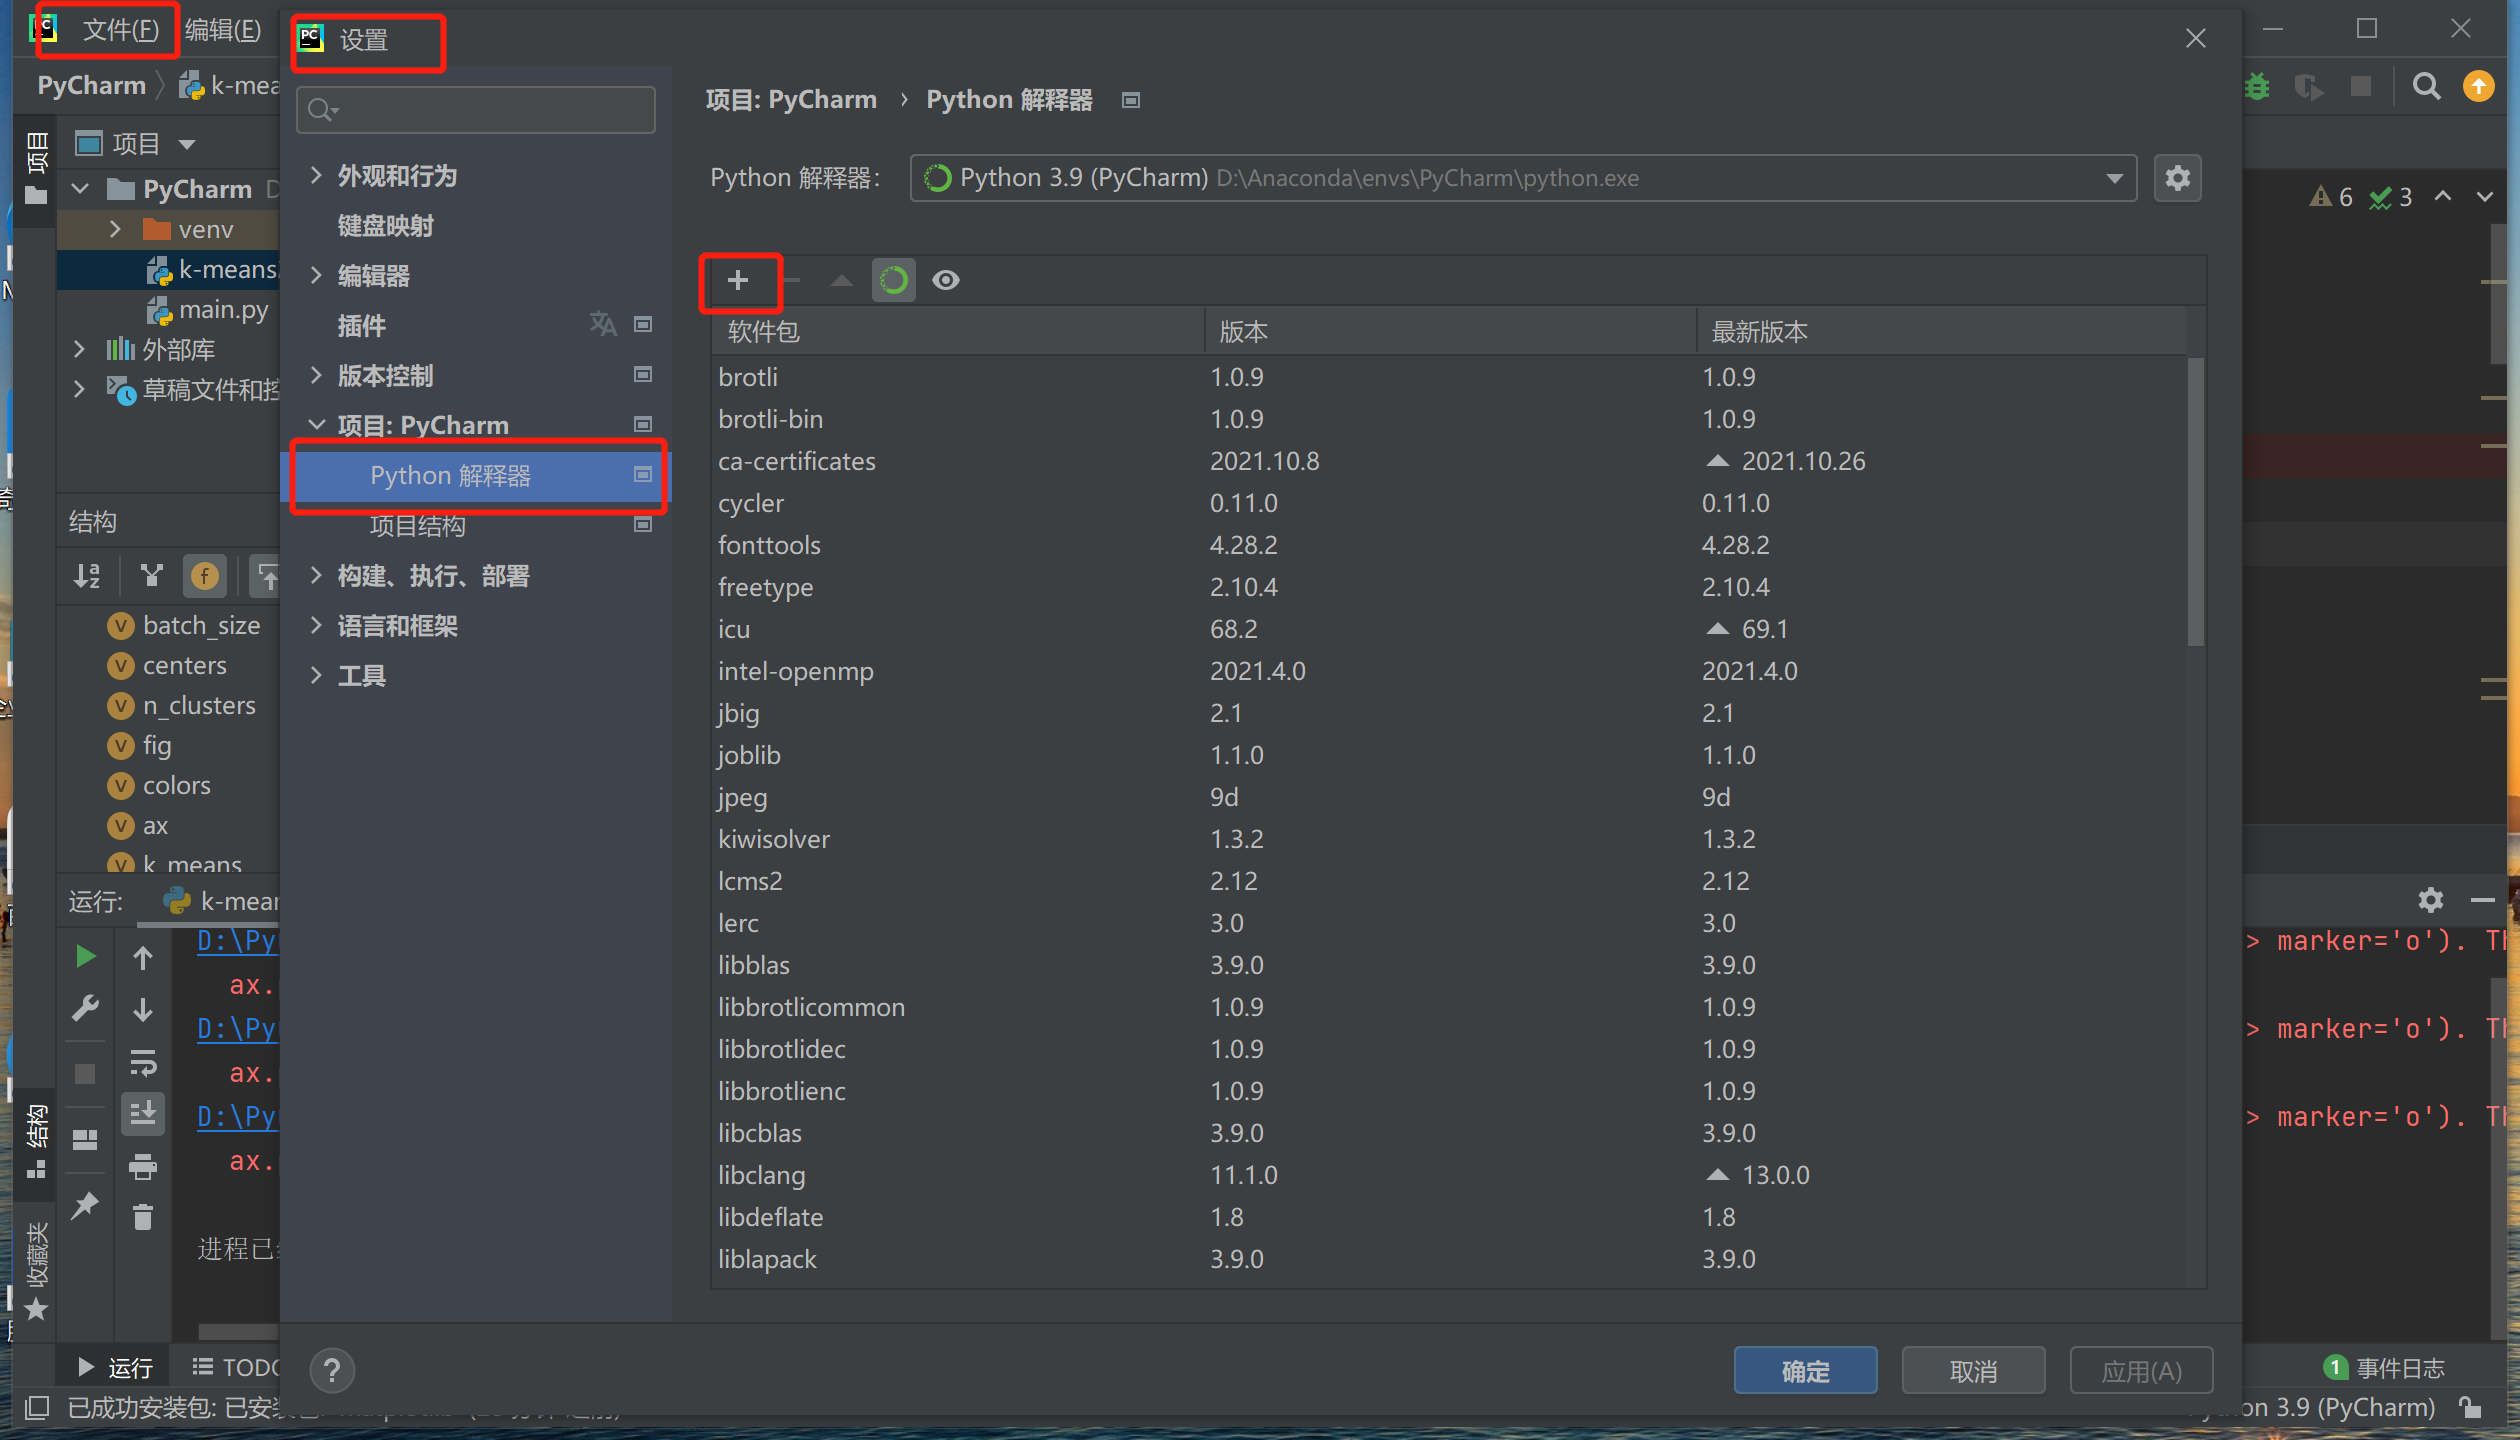
IDE:PyCharm
Environment: Anaconda
Python package: Sklearn, Numpy, Matplotlib
1. Import the required Python package
1.
K-MEANS In Sklearn.Cluster, when using the K-MEANS clustering class, we only need:
from sklearn.cluster import KMeansThe definition of K-MEANS in Python's three-party library is like this:
class sklearn.cluster.KMeans(n_clusters=8, init=’k-means++’, n_init=10, max_iter=300, tol=0.0001, precompute_distances=’auto’, verbose=0, random_state=None, copy_x=True, n_jobs=None, algorithm=’auto’)The meaning of each input parameter
n_clusters : int, optional, default: 8
It means the number of clusters to be generated, or the number of cluster centers. It is an integer number, the default value is 8;
init : {‘k-means++’, ‘random’ or an ndarray}
It means the initialization method of data that needs to be polyclass. The default method is 'k-means ++'.
There are three ways to initialize: K-MEANS ++, Random, or an array.
The K-MEANS ++ can intelligently select the initial cluster center for K average polyclass to speed up convergence.
Random is a random selection K observation value from the data as the initial cluster center.
It can also be passed to an array of an array as an initialized cluster center, then the structure of this array should be (N_Clusters, N_FEATURES).
n_init : int, default: 10
The number of times of the K-MEANS algorithm selects a cluster center, with the default value of 10. The final result of the cluster center is the best result (good refers to the length of time).
max_iter : int, default: 300
The maximum number of iterations of the K-MEANS algorithm each time, the default value is 300.
tol : float, default: 1e-4
It is equivalent to the accuracy requirements of iterative termination. The error that can be allowed. When this accuracy is met, the clustering convergence, finding the optimal solution, can stop iteration, the default value is 10-4.
precompute_distances : {‘auto’, True, False}
Calculate the distance in advance and weigh the space and time. This will be faster, but it will occupy more memory, and the default value is 'AUTO'.
‘Auto’ Refers to N_SAMPLES * N_Clusters> 1.2 billion, and do not calculate the distance in advance. This is equivalent to the use of dual -precision each job of about 100MB of memory.
‘True’ Refers to always calculate the distance in advance.
‘False’ refers to the distance without pre -calculation.
verbose : int, default 0
Whether to output details, the default value is 0.
random_state : int, RandomState instance or None (default)
Determine the random number of the cluster center. The randomness of a integer number is certain, and the default value is None.
copy_x : boolean, optional
BOOL will have this parameter in many interfaces of Scikit-Learn. Whether to continue copying the input data in order to not modify the user's input data. The default value is TRUE. When True, the original data is not modified to ensure that X is C-Contious, and the original data is not modified after clustering. When FALSE, the original data is modified. Put the modified back to X before the function returns. It is C-Contious, which may make the speed decrease significantly.
n_jobs : int or None, optional (default=None)
The number of use processes is related to the computer CPU. The default value is None.
algorithm : “auto”, “full” or “elkan”, default=“auto”
The K-MEANS algorithm used, "Full" refers to the classic EM-Style algorithm; "Elkan" uses triangle inconsistencies, so it is more efficient, but currently does not support sparse data; "Auto" is when data dense, select "" Elkan, when the data is sparse, select "Full".
Function return value
** Cluster_centers_: ** Centers of the Center.
If the algorithm stops completely, it will be inconsistent with Labels_.
** Labels_: ** The label of each point.
** Inrtia _: ** Sample to the square harmony of the cluster center.
** n_iter _: ** number of iteration running.
method
| function | Function |
| fit(X[, y, sample_weight]) | Calculate K-MEANS cluster |
| fit_predict(X[, y, sample_weight]) | Calculate the cluster center of each sample and predict cluster index |
| fit_transform(X[, y, sample_weight]) | Calculate the clustering and transform the X to a clustering distance space. |
| get_params([deep]) | Get this parameter of this estimation function. |
| predict(X[, sample_weight]) | Predict the nearest cluster of each sample in X. |
| score(X[, y, sample_weight]) | Contrary to the X value on the K -average target. |
| set_params(**params) | Set the parameters of this estimation function. |
| transform(X) | Convert X to a cluster distance space |
2.NumPy
Numpy (Numerical Python) is an extended program library in the Python language that supports a large number of dimensions and matrix operations. In addition, it also provides a large number of mathematical function libraries for array operations. Learn reference link:
3.matplotlib
It may be the most widely used kit in the field of Python 2D-drawing. It allows users to graphically graphics and provide a variety of output formats. Learn reference link:
2. Experimental code
Because it was just beginning to learn, the code of the first blog post was cited, but detailed annotations were made according to their own situation.
1.
From Sklearn.Cluster Import Kmeans #Import KMEANS module from the Sklearn.cluster package
 Import Numpy as NP #imports the Numpy module, and can only be referenced by NP later

 # X, and calculate the K-MEANS cluster
 X = np.array ([[1, 2], [1, 4], [1, 0], [4, 2], [4, 4], [4, 0]))#Create a array
 kmeans = kmeans (n_clusters = 2, random_state = 0) .fit (x)#to generate two clusters, .fit used the training collection data fitting model

 # Output and tags (ie categories) at each sample point after the output and cluster, predict the category of the new sample point
print(kmeans.labels_)
 Print (kmeans.predick ([[0, 0], [4], [2, 1]])#. Predict predicts new data prediction
The output result is:
[0 0 0 1 1 1]
[0 1 0]
2.
import time
import numpy as np
import matplotlib.pyplot as plt
from sklearn.cluster import KMeans
#pairwise_distances_argmin Calculate the minimum distance between a point and a set of points
from sklearn.metrics.pairwise import pairwise_distances_argmin
#Make_blobs generate cluster data set
from sklearn.datasets._samples_generator import make_blobs
# ######################################
# Generate sample data
np.random.seed(0)
batch_size = 45
centers = [[1, 1], [-1, -1], [1, -1]]
n_clusters = len(centers)
#Make_blobs: 3000 points for the sample, the center end of the data is Center, the variance of each category is 0.7, and the X array, labels are returned
X, labels_true = make_blobs(n_samples=3000, centers=centers, cluster_std=0.7)
# plot result
#8*3 inches
fig = plt.figure(figsize=(8,3))
#The left side, right side, below, and upper position of the zig map
fig.subplots_adjust(left=0.02, right=0.98, bottom=0.05, top=0.9)
colors = ['#4EACC5', '#FF9C34', '#4E9A06']
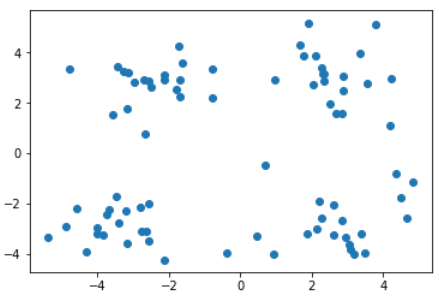
# original data
#: The first one in one line and two columns
ax = fig.add_subplot(1,2,1)
#Addles of array
row, _ = np.shape(X)
#
for i in range(row):
ax.plot(X[i, 0], X[i, 1], '#4EACC5', marker='.')
#Title
ax.set_title('Original Data')
ax.set_xticks(())
ax.set_yticks(())
# compute clustering with K-Means
#Customized initial cluster centers: K-MEANS ++ is a enhanced version of K-MEANS.
#The number of clusters generated 3
#Select the number of times of cluster center 10
k_means = KMeans(init='k-means++', n_clusters=3, n_init=10)
#Return to the current time stamp
t0 = time.time()
#Training set
k_means.fit(X)
#
t_batch = time.time() - t0
#Pripping the increase of the cluster centers
k_means_cluster_centers = np.sort(k_means.cluster_centers_, axis=0)
#Calculate the minimum distance between a point and a set of points.
k_means_labels = pairwise_distances_argmin(X, k_means_cluster_centers)
# K-means
#: The second one in one line and two columns
ax = fig.add_subplot(1, 2, 2)
#Function is used to the iterative objects as a parameter, packaged the corresponding elements in the object into each of the metal groups, and then returned a list composed of these meta -groups
#
for k, col in zip(range(n_clusters), colors):
My_members = k_means_labels == k # my_members is a Boolean array (for screening similar points, represented by different colors)
cluster_center = k_means_cluster_centers[k]
ax.plot(X[my_members, 0], X[my_members, 1], 'w',
MarkerfaceColor = color, marker = '.') #
ax.plot(cluster_center[0], cluster_center[1], 'o', markerfacecolor=col,
markeredgecolor = 'k', marker = 'o') #
ax.set_title('KMeans')
ax.set_xticks(())
ax.set_yticks(())
#5 (-3.5, 1.8) position add text
plt.text(-3.5, 1.8, 'train time: %.2fs\ninertia: %f' % (t_batch, k_means.inertia_))
#Show all open graphics
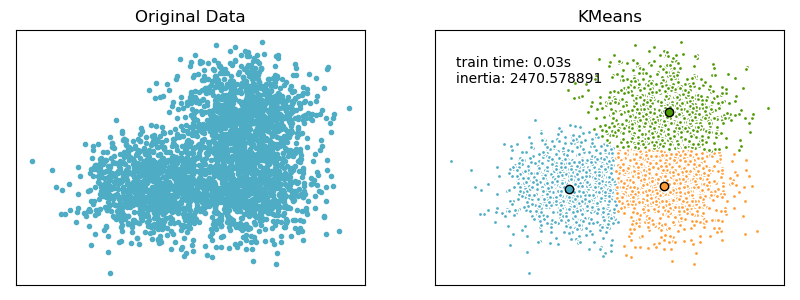
plt.show()
Output results:
Intelligent Recommendation
[Learning Notes] Python Implementation K-Means Cluster Algorithm
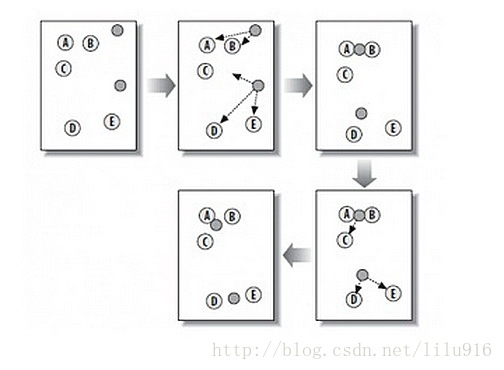
K-Means Cluster Algorithm The K-Means clustering algorithm is divided by k, dividing N objects into k clusters, enabling a higher similarity in the cluster, and the cluster is low. The process is as f...
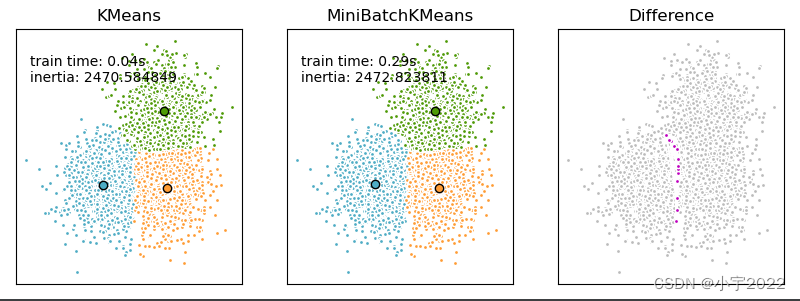
Python Learning --- K-MEANS and Minibatchkmeans cluster algorithm comparison
Comparison of the K-Means and MiniBatchKMeans clustering algorithms We want to compare the performance of the MiniBatchKMeans and KMeans: the MiniBatchKMeans is faster, but gives slightly different re...
Python Machine Learning Experimental Class K-MEANS cluster code and annotation
The dataset is an iris flower dataset with 4 characteristics and 3 categories. It is divided into training sets and test sets. K-MEANS clusters are performed to learn the K-MEANS cluster algorithm....

Machine learning-K-means (1)
1. Algorithm overview: Clustering is an unsupervised learning that groups similar objects into the same cluster. It is a bit like automatic classification. The clustering method can be applied to almo...

Machine Learning Cluster Analysis K-Means
Recently, I have always wanted to use clustering to analyze the current data. Today I found a "python data analysis and mining actual combat", which has a case that introduces the analysis o...
More Recommendation
Machine learning-K-means cluster analysis
1. Introduction to K-means clustering algorithm 1. Principle of K-means clustering algorithm (1) First throw a situational question How does the airline group customers, distinguish high-value custome...
Understanding of machine learning - (cluster) K-means
1. K-Means Overview The algorithm accepts parameter k; then the N data object input input is divided into k clusters to satisfy the obtained cluster: the same cluster is similar, and the object simila...
Machine learning - logic regression and K-Means cluster
Machine learning - logic regression and K-Means cluster Logic regression K-Means cluster Logic regression The linear regression is used as an input, using the Sigmoid function to obtain a probability ...

Machine learning: K-means handwritten digital cluster
K-Means Introduction K-Means is our most commonly used European-based clustering algorithm that believes that the distance between the two goals is closer, the greater the similarity. At the beginning...
[Learning Notes] K-Means Cluster Algorithm
contents Knowledge system Thought Related concepts Algorithm process Code Ch value selection Election of the initial center point K-Means Disadvantages Reference article references Knowledge system K-...