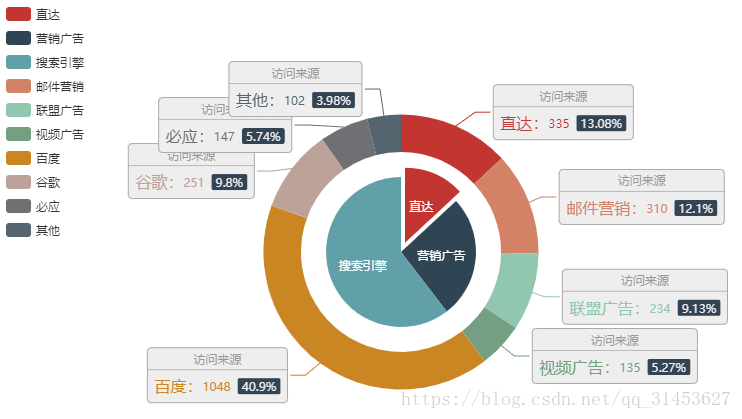
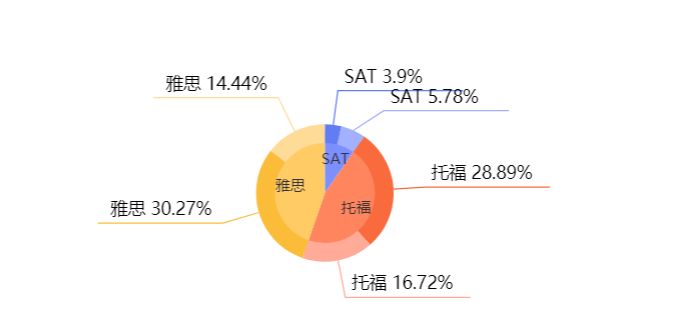
echarts pie chart with text in the center

var option = {
        title: {
          text: circularGraph.title, //title text
          left: "center",
                     show: circularGraph.head //Whether to display the title component
        },
        tooltip: {
          trigger: "item",
          formatter: "{b}: {c} ({d}%)"
        },
        legend: {
          show: true,
          orient: "horizontal",
          x: "center",
          y: "bottom",
                     data: circularGraph.tuglie, //Legend component
          formatter: function(name) {
            let num = "";
                         circularGraph.data.forEach(item => {//Format the legend text, support two forms of string template and callback function.
              if (item.name === name) {
                num = String(item.value).replace(/(\d)(?=(?:\d{6})+$)/g, "$1.");
                return;
              }
            });
            return name + ":" + num;
          }
        },
        graphic: {
          type: "text",
          left: "center",
          top: "center",
          style: {
            text:
                             circularGraph.sum.name + //The center of the circle displays the data, here is the total displayed
              "\n" +
              String(circularGraph.sum.number).replace(
                /(\d)(?=(?:\d{6})+$)/g,
                "$1."
              ),
            textAlign: "center",
            fill: "#000",
            width: 30,
            height: 30,
            fontSize: 12
          }
        },
        series: [
          {
            type: "pie",
            radius: ["35%", "65%"],
            itemStyle: {
              normal: {
                label: {
                  show: true,
                  textStyle: { color: "#3c4858", fontSize: "12" },
                  formatter: function(val) {
                                         //Let the text in the series wrap
                    return val.name + "(" + val.percent + "%)";
                  }
                },
                labelLine: {
                  show: true,
                  lineStyle: { color: "#3c4858" }
                }
              },
              emphasis: {
                shadowBlur: 10,
                shadowOffsetX: 0,
                shadowColor: "rgba(0, 0, 0, 0.5)",
                textColor: "#000"
              }
            },
                         data: circularGraph.data //data
          }
        ],
                 color: circularGraph.color //color
      };
Intelligent Recommendation
Overlapping text in echarts pie chart and its solution
When implementing the foreground style, I found that the text part of the pie chart overlapped Article Directory Preface 1. Solution Preface When implementing the foreground style, I found that the te...
echarts learning to add text to the middle of the pie chart
First look at the effect of the pie chart: Method 1: Use series Just write like this in the formatter, and write the style you need in rich. formatter:'{total|' + this.total +'}'+'\n\r' +'{active|tota...
Echarts pie chart middle text information settings
effect Set the graphic and title attributes, as the code above ...
Echarts pie chart Label text above labelline
First above the final renderings Main configuration: The main code is the setting of the Padding, must be set on both sides, otherwise it will be shifted!...
Echarts Pie Chart Text Overflow Screen
Solution: Adaptation of the string adaptation. ...
More Recommendation
Echarts pie chart Add text, Title, Graphic
Transfer from: https://www.jianshu.com/p/850e54cd696d...
Vue echarts pie chart text and graphic color
Effect: over...
Echarts Implementation of the pie chart plus text
That is, add one of the same level {} in the series: [] of the original pie chart. The content placed only is only for the intermediate text display....