Multi-threaded (/ MT) VS in, multi-threaded debugging (/ MTd), the difference between multi-threaded DLL (/ MD), debugging multi-threaded DLL (/ MDd) of
tags: Visual Studio
A language development environment often comes with language libraries, which is the API of the operating system for the packaging, we also call these language runtime library.
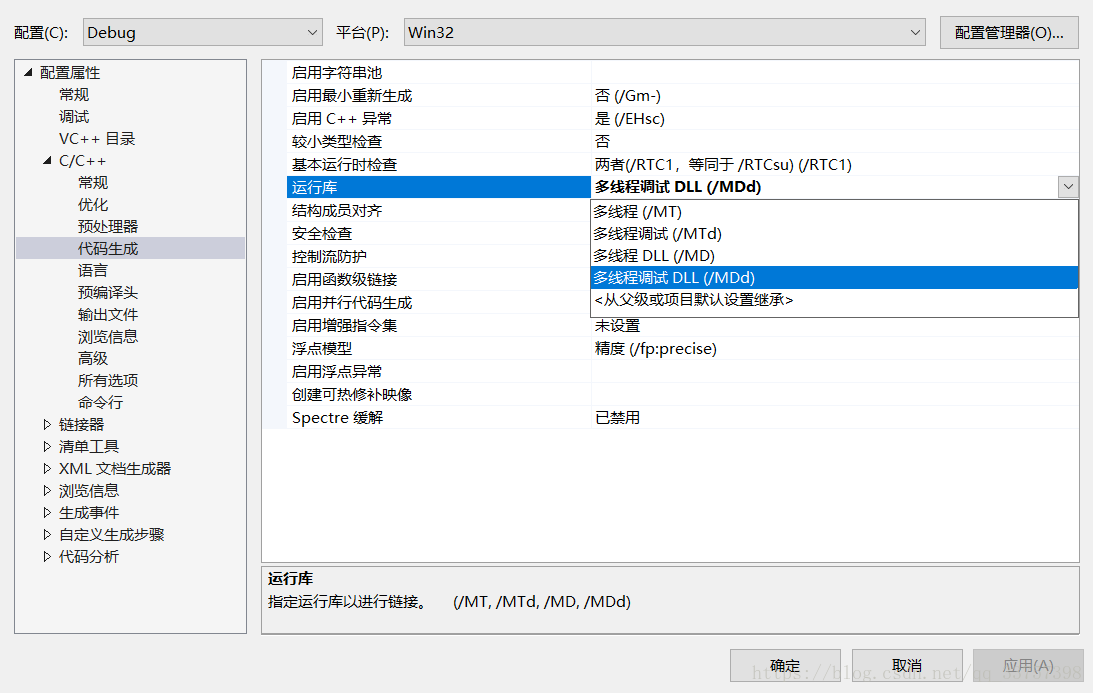
For MSVC runtime (CRT), according to the static / dynamic linking, can be divided into static and dynamic version version; in accordance with debug / release, can be divided into debug and release versions; in accordance with the single-threaded / multi-threaded, can be divided into single-threaded version and multi-threaded version (VS but currently has not provided a single-threaded version)
In debug mode, use the debug runtime: multi-threaded debugging (/ MTd), debugging multi-threaded DLL (/ MDd)
in release mode, use the Publish runtime: multi-threaded (/ MT), multi-threaded DLL (/ MD)
D runtime with debug mode, but without the release mode. Commissioning and publishing difference is that the release mode debugging information omitted from the program, is simply to delete the contents for debugging in debug mode, so under normal circumstances, the size of the resulting executable file release mode than the debug mode to the next generation of small
Static links: multi-threaded (/ MT), multi-threaded debugging (/ MTd)
Dynamic Link: Multithreaded DLL (/ MD), multi-thread debugging DLL (/ MDd)
Dynamic Link is D, static link to T. The difference is, statically linked to integrated programs depend on libraries to run the executable file is no longer required runtime executable file is run; dynamically linked program did not depend on runtime integrated into the executable file, libraries need to run the executable file is run. Since statically linked program runtime depends integrated into the executable file, in general, the size of the resulting executable file is larger than the dynamic link generating
These four kinds selected from the runtime located VS project properties - "C / C + ±" Code Generation - "Runtime:
Intelligent Recommendation
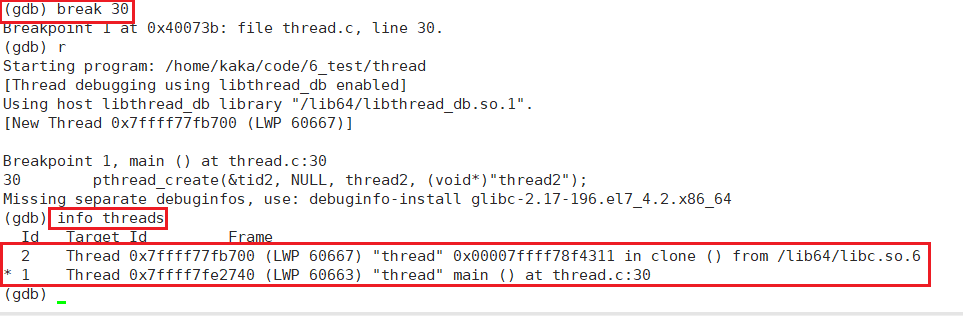
Multi-threaded debugging with GDB
First, multi-threaded debugging Multi-threaded debugging Important is the following command: Info Thread View the thread of the current process. thread <id> Switch the debug thread is the thread...
C# multi-threaded debugging
Table of contents summary Details Debugging Tips 1: Debug Tips 2: summary This article mainly shares multi-threaded partial debugging skills, and you will often encounter the need for multi-thr...
Multi-threaded-multi-threaded debug debugging (very very detailed debugging)
In daily development, we often encounter multi-threaded Debug debugging, Generally, we use Spring Boot to provide interfaces to the outside world. When multiple people access at the same time in Tomca...

[java] debugging multi-threaded program
When debugging a multi-threaded application, debugging went to a certain location and found that the main thread was blocked, but could not continue to run. Later, it was discovered that the sub-proce...
jstack multi-threaded code debugging
Sort query consume cpu thread under linux 1 Instruction: top -H -p pid Binary conversion 1304 cpu highest consumption, converting decimal to hexadecimal 518 3 threads inquiry Instruction: jstack serve...
More Recommendation
C ++ debugging multi-threaded competition
https://stackoverflow.com/questions/39529000/c-threads-race-condition-simulation Using g++ with -fsanitize=thread -static-libtsan: shows the race condition. (Also, on my system the output shows...
Simple gdb debugging multi-threaded
Gdb debugging multithreaded use the following command: 1.info threads: threads can show all debugging. gdb assigns an ID for each thread (tid and different), generally numbered from 1 starts. Behind t...
gdb debugging multi-threaded principle
Share thank the original author, editor: 1: Gdb On Linux system provides a set of multi-thread debugging command, as shown in the table: Multi-thread debuggingThe main task isAccurate and timely captu...
IDEA multi-threaded debugging settings
Go to: When using idea to debug multithreading, it was found that multithreading cannot be debugged.Later, after searching, it was found that idea breakpoints have different modes.Only when in Thread ...
Linux: gdb debugging multi-threaded
We still list the basic operations of gdb here: •List(l) line number: display source code. Display 10 lines at a time •list(l) function name: List the source code of a function •r or ru...