"Python Data Processing Basis" data lack value visualization and processing 8 common methods
tags: # Data Analysis Software Tool Application python data processing Lack value Machine learning
Article catalog
Introduction
In daily data analysis, the missing value in the data is one of the most headache.
During the time of daily data acquisition, due to various reasons, the data is deleted in the process of data acquisition, generally represented by spaces, nan, and placeholders. However, these contents are unable to be compatible with algorithms in the application's machine learning or depth learning model, because the auto-variable in the INPUT must be a specific element.
Due to a variety of reasons, many of the data sets in the real world contain missing data, which are often encoded into spaces, Nans, or other placeholders. But such a data set cannot be compatible with the SCIKIT - Learn algorithm, because most of the learning algorithms will default to the elements in the array are values, so the elements of the vocabulary have their own representative meaning.
This article describes the visualization and processing routines for data missing values in daily work.
Data set application disclosed competition case data for example, download addressMachine Learning Repository Machine Learning Library。

Definition of missing value
It is a data record to be lost, also known as data logging. The lack of data columns, that is, due to various reasons, the data is missing.
Visualization of missing values
# Install the missing value to handle third parties
pip install missingno
# Use Missingno
import missingno as msno
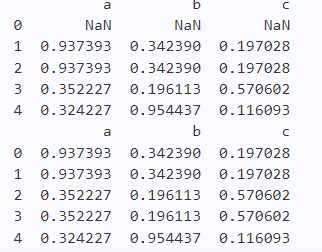
# Visualized to the read data lack value, the blank part is part of the column data
# The original data is as follows

#
msno.matrix(data, labels=True)

# Bar Chart Displays missing data
msno.bar(data, labels=True)

#            , directly display the correlation between the field data by thermal map
msno.heatmap(data, labels=True)

# Tree diagram Displays the missing data, the soldiers directly display the correlation between the field data through the thermal map
msno.dendrogram(recent)
Default treatment method
- Direct discard: The whole line or the entire extension, cut the important field to delete the important field.
# Directly override the original table structure to delete the line containing missing data
recent.dropna(inplace=True)
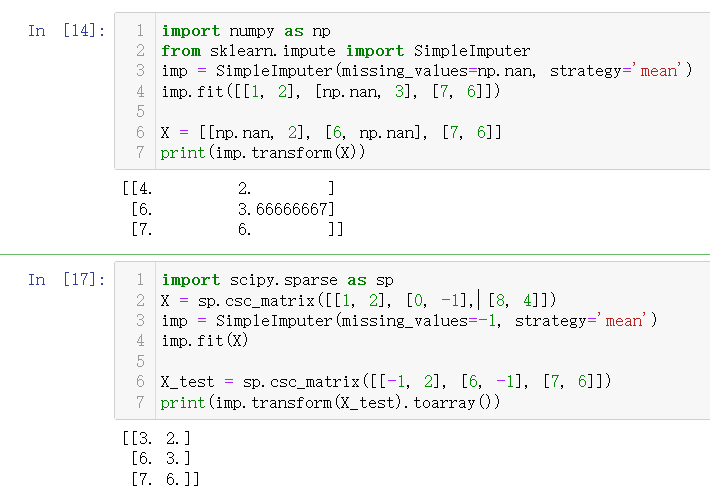
- statistical methods: Digital data is used for average, weighted average, median, and the like.
#         Name as col

#
recent['col'].fillna(recent['col'].mean())
# Fill blank data using the median number
recent['col'].fillna(recent['col'].median())
# Fill blank data using the number
recent['col'].fillna(recent['col'].mode())
- Modeling method: Value variables, use regression models; classified variables, use classification models.
# Ie the missing field as the variable, other fields that can provide information as a simple regression equation processing

#             Numerical Prediction
import numpy as np
from sklearn.linear_model import LinearRegression
X = np.array([[1, 1], [1, 2], [2, 2], [2, 3]])
# y = 1 * x_0 + 2 * x_1 + 3
y = np.dot(X, np.array([1, 2])) + 3
reg = LinearRegression().fit(X, y)
reg.predict(np.array([[3, 5]]))

# SVM classification model category prediction
from sklearn.svm import LinearSVC
from sklearn.pipeline import make_pipeline
from sklearn.preprocessing import StandardScaler
from sklearn.datasets import make_classification
X, y = make_classification(n_features=4, random_state=0)
clf = make_pipeline(StandardScaler(),
                    LinearSVC(random_state=0, tol=1e-5))
clf.fit(X, y)
clf.predict([[0, 0, 0, 0]])
- Experts added: For small amounts of important data, experts or salesperson supplemented according to experience.
- Other methods: For example, a random method, a special value method, multiple fills, etc.
- Truth conversion: Non-digital data in conversion data cannot participate in model and statistical calculations.
# Conversion using a dictionary traversal
size_mapping = {'str1':1, 'str2':2, 'str3':3}
import numpy as np
class_mapping = {label: idx for idx, label in enumerate(np.unique(recent['classlabel']))}
recent['classlabel'] = recent['classlabel'].map(class_mapping)
- No need to deal with: The algorithm model of tolerance lack value is selected, for example, DBSCAN without processing.
- Defier treatment: In some cases, we can ignore the impact of lackings.
# Use the PCA to reduce the dimension, convert the original data as a result of not explaining
import numpy as np
from sklearn.decomposition import PCA
X = np.array([[-1, -1], [-2, -1], [-3, -2], [1, 1], [2, 1], [3, 2]])
pca = PCA(n_components=2)
pca.fit(X)
Intelligent Recommendation
[Python Data processing chapter -DataFrame data cleaning] Repeated value processing, lack value processing, specific value replacement, delete specified condition row
Welcome to visit me [Zhihu account]:Coffee And my [station B Man editing account]:VideosMan If my note is helpful to you, please use a small finger to order a big praise. Regarding the relevant knowle...
Python data processing and visualization
Numpy ID Price Area Bedroom Basement 1 200 105 3 false 2 165 80 2 false 3 184.5 120 2 false 4 116 70.8 1 false 5 270 150 4 true ID stands for labels. General labels are unique. Machine learning is gen...
Data lack processing
First, the method of processing lack value Due to a variety of reasons, many of the data sets in the real world contain missing data, which are often encoded into spaces, Nans, or other placeholders. ...
DROPNA lack of data processing
Pandas official API Function prototype Parametric meaning axis{0 or ‘index’, 1 or ‘columns’}, default 0 Determine if rows or columns which contain missing values are removed. 0...
More Recommendation
PANDAS DataFRAME Lack of Value Processing (data pre -processing)
PANDAS DataFRAME Lack of Value Processing (data pre -processing) Create Dataframe data samples The output result is as follows: See if there are several ways to lose values in each field The output ...
Data visualization of Python data processing
Data visualization of Python data processing (1) Today, I briefly summarized some basic knowledge points of data visualization, and I hope it will be helpful to small codes (use the matplotlib package...

[Python data analysis]: Data pre -processing lack of valuing processing
• Number of this text: about 1300 words • Reading time: about 2 minutes • Difficulty: 2 stars The lack of data mainly includes the lack of records and the lack of field information. It ...
Data analysis internship encounter database lack of data dictionary processing methods
On the first day of the data analysis, a set of MySQL connection methods are given. There is nothing else, and ask the data dictionary is outsourcing. Let's talk about solutions first Option One: It w...
Python pandas common data processing methods
pandas reference: http://pandas.pydata.org/pandas-docs/stable/10min.htmlOfficial 10 minute tutorial...