Python Matplotlib drawing does not display Chinese garbled Chinese fonts
tags: question python Development language rear end
When using Python Matplotlib drawing, because the Matplotlib uses the font of Dejavu Sans default, it does not support Chinese. Therefore
So how do we set up to display Chinese?
Let me share my experience:
1. View the font in the Matplotlib font library
from matplotlib import pyplot as plt
import matplotlib
 Print (matplotlib.font_Manager.fontmanager.ttflist) # output all font names
Output effect:
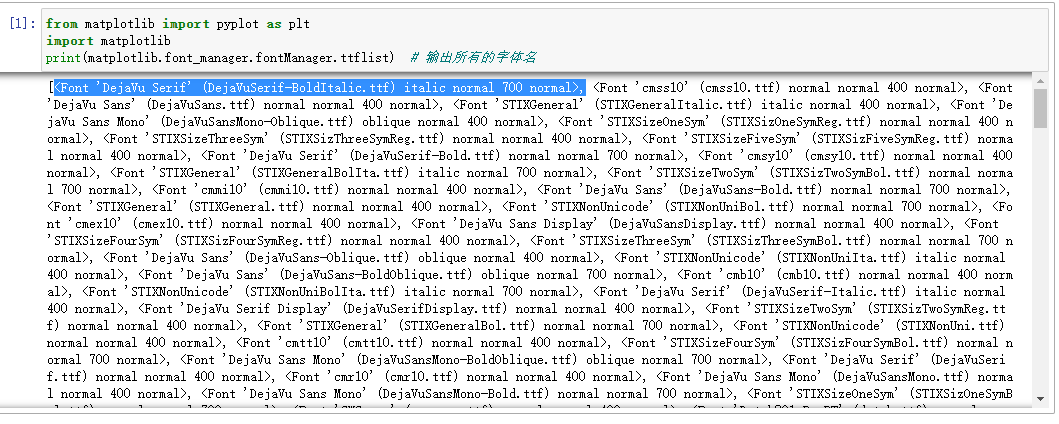
The list element is:
<Font 'DejaVu Serif' (DejaVuSerif-BoldItalic.ttf) italic normal 700 normal>
The type is <class 'matplotlib.font_manager.fontentry'>
This contains font names, font file names, etc.
You can view all the usage of the Fontentry object with through
['__class__',
 '__delattr__',
 '__dict__',
 '__dir__',
 '__doc__',
 '__eq__',
 '__format__',
 '__ge__',
 '__getattribute__',
 '__gt__',
 '__hash__',
 '__init__',
 '__init_subclass__',
 '__le__',
 '__lt__',
 '__module__',
 '__ne__',
 '__new__',
 '__reduce__',
 '__reduce_ex__',
 '__repr__',
 '__setattr__',
 '__sizeof__',
 '__str__',
 '__subclasshook__',
 '__weakref__',
 'FNAME', # file path name
   'name', # font name
 'size',
 'stretch',
 'style',
 'variant',
 'weight']
We can view the path and file name of the font through the FNAME attribute:
matplotlib.font_Manager.fontManager.ttflist [0] .fname obtained
'c:\\users\\administrator\\appdata\\local\\programs\\python\\python38\\lib\\site-packages\\matplotlib\\mpl-data\\fonts\\ttf\\DejaVuSerif-BoldItalic.ttf'
We can view the font name through the name attribute:
matplotlib.font_Manager.fontmanager.ttflist [0] .name got 'dejavu serif'. With this font name, we can set the fonts we want, and use for to traverse the matplotlib.font_manager.fontmanager.ttflist to get all the font names. It's right.
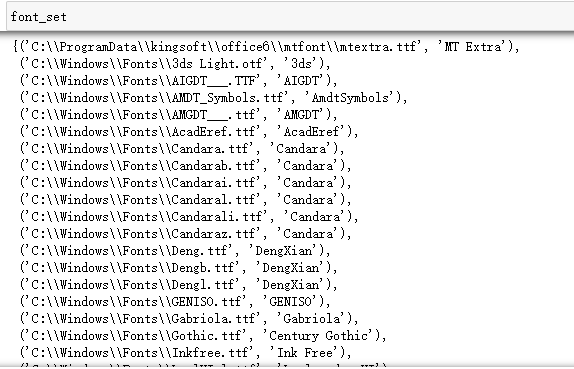
font_list = matplotlib.font_manager.fontManager.ttflist
font_Set = set () # f f The collection of font paths and font name matches
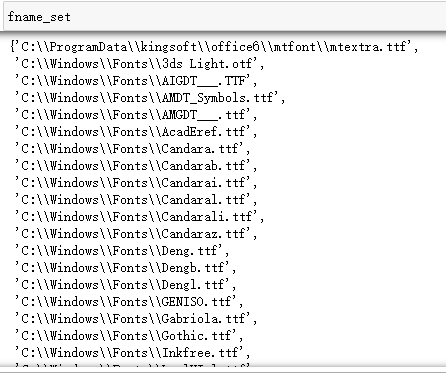
FNAME_SET = SET () # The collection of font path
name_set = set () # The collection of font name
for font in font_list:
font_set.add((font.fname,font.name))
fname_set.add(font.fname)
name_set.add(font.name)Three sets are defined above
font_Set = set ()# f The collection of font paths and font names is used to find the corresponding font.
FNAME_SET = SET ()# The collection of font paths, let's see where the fonts of Matplotlib are from.
name_set = set ()# The collection of font names, set the fonts we want from here.
Next, we will output:
Let's extract the path folder first to see which folders are:
import os
fload_set = set()
for i in fname_set:
         flow_Set.add (OS.Path.Split (i) [0]) # Use os.path.split to extract the path in the file path
Output: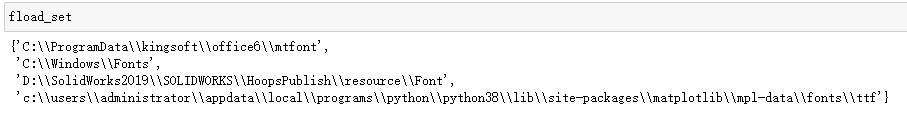
It can be seen here that there are four paths. My computer is a win10 system.
'C: \\ Programdata \\ KingSoft \\ Office6 \\ mtfont' is the font path of WPS
'C: \\ windows \\ fonts' is the font path of the Windows system
'D: \\ Solidworks2019 \\ Solidworks \\ HOOPSPUBLISH \\ Resource \\ font' is the font path of the 3D drawing software Solidworks
'C: \\ Users \\ administrator \\ appdata \\ local \\ programs \\ python \\ python38 \\ size size-packages \\ mpl-data \\ fonts \ \ \ \ ttf The font path
Therefore, the font obtained by Matplotlib not only has its own font, but also absorbs many fonts we installed.
Quickly output several common Chinese fonts:
from matplotlib import pyplot as plt
import matplotlib
ch_set = set()
for I in Matplotlib.font_Manager.fontManager.ttflist: # Matplotlib all fonts list
if 'kai' in str (i): # The font of the 'kai' (Kaita)
ch_set.add(i.name)
Elif'd 'in Str (i): # The font containing' song '(Song style)
ch_set.add(i.name)
Elif' Hei 'in Str (i): # The font (black body) containing' hei '
ch_set.add(i.name)
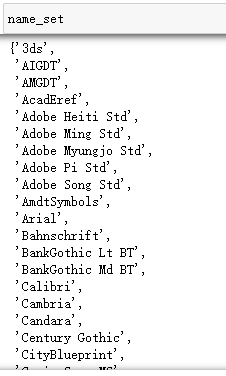
CH_SET # outputOutput:
{'Adobe Heiti Std',
 'Adobe Song Std',
 'FZCuHeiSongS-B-GB',
 'FangSong',
 'HYSWLongFangSong',
 'KaiTi',
 'Microsoft JhengHei',
 'Microsoft YaHei',
 'SimHei'}
2. Set the Chinese font we want
For example, we want to use [Han Yichang to imitate the Song style], and we must first know what its font is called to apply it to Matplotlib.
Right -click on the desktop [Personalization] → [Font]
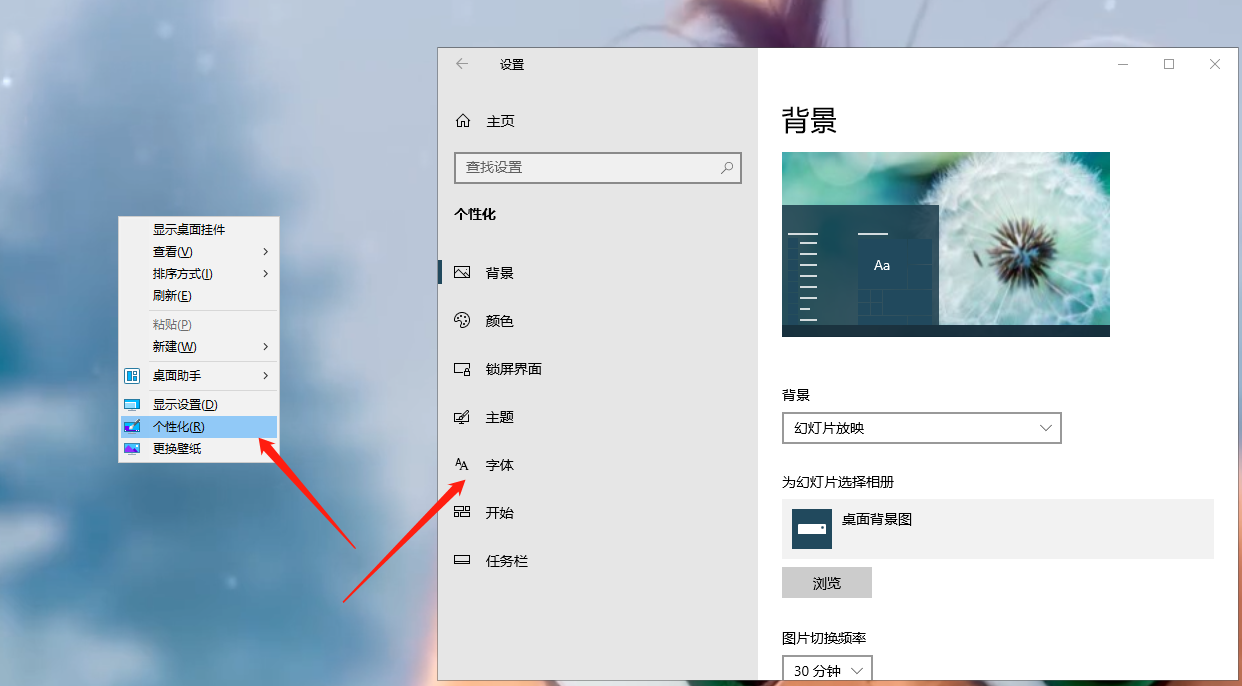
[Available fonts] Input box input box input [Han Yi] keyword search font, and then click the font you searched below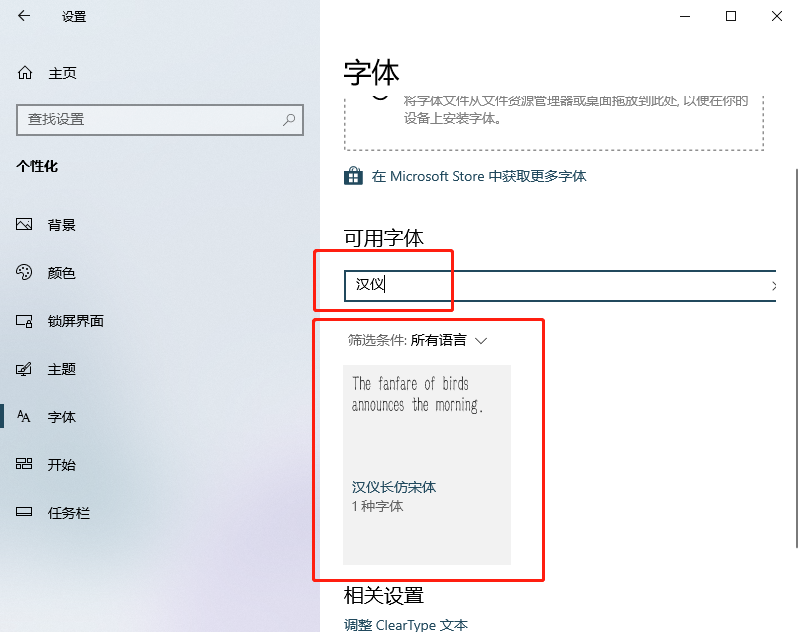
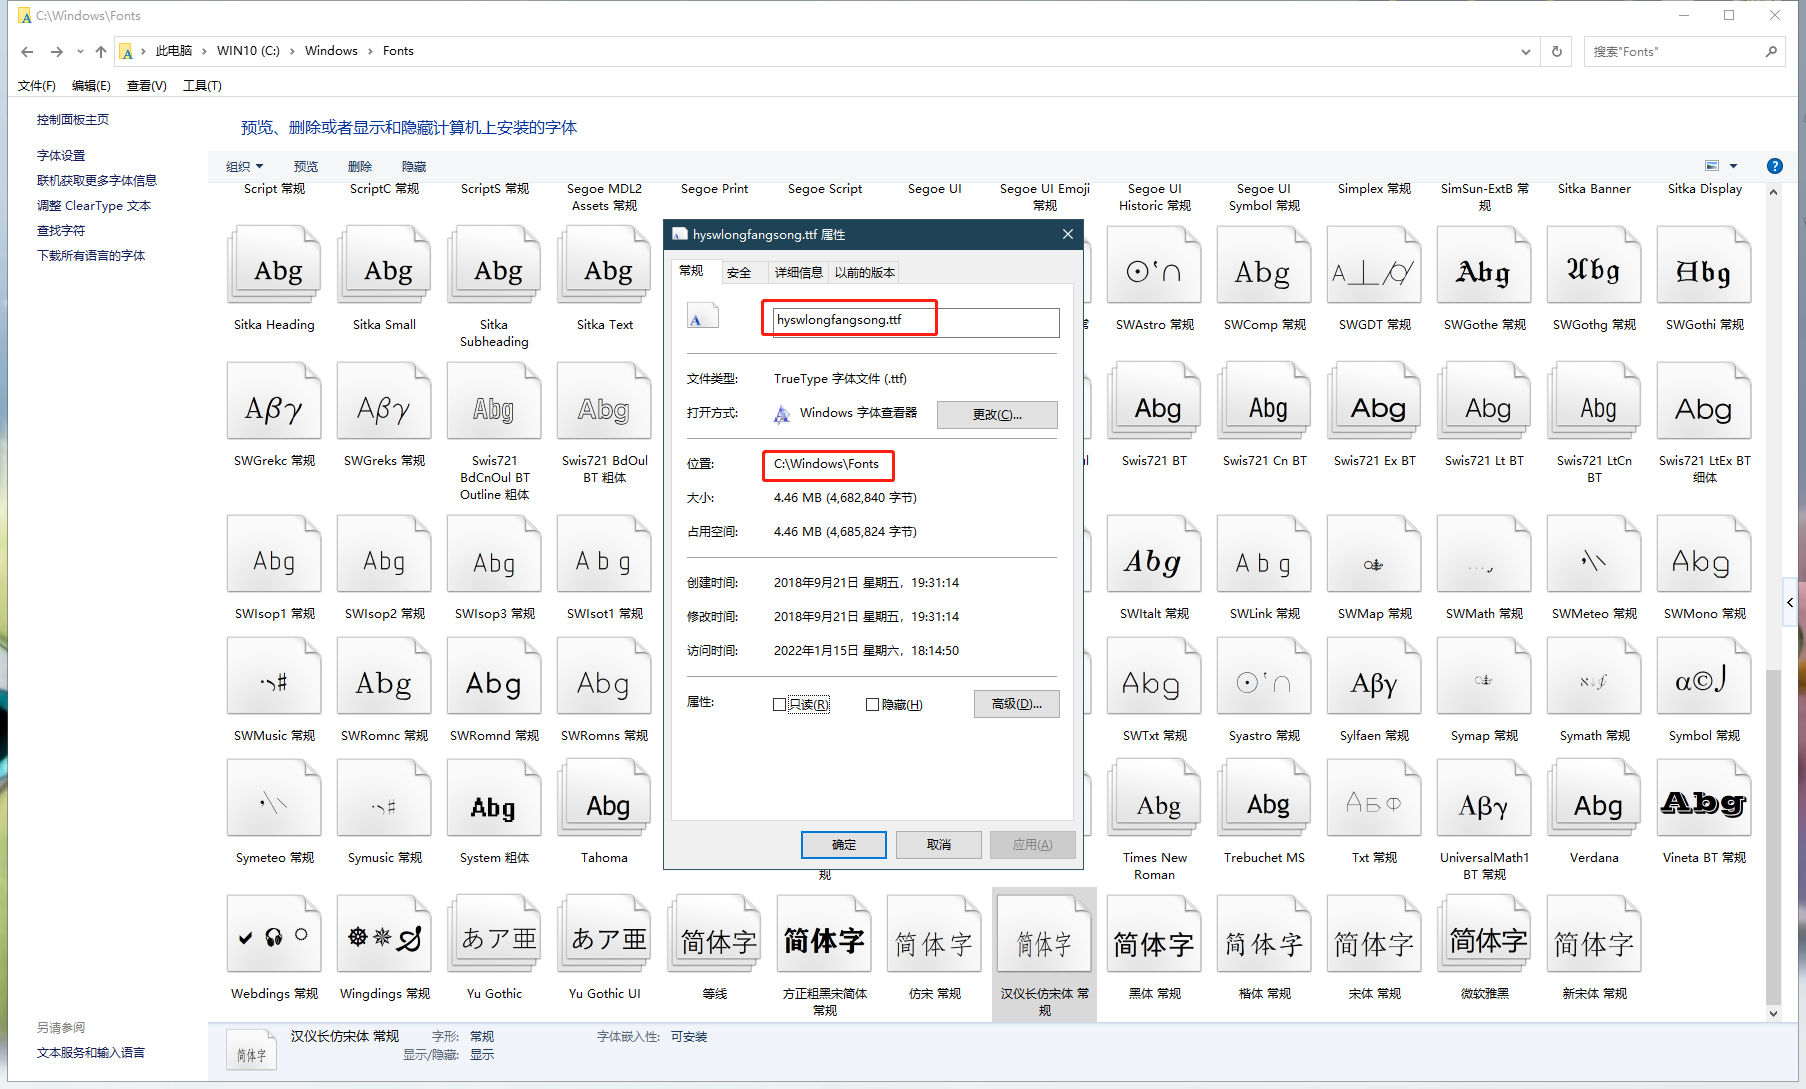
You can see the path of the font in the corresponding font information interface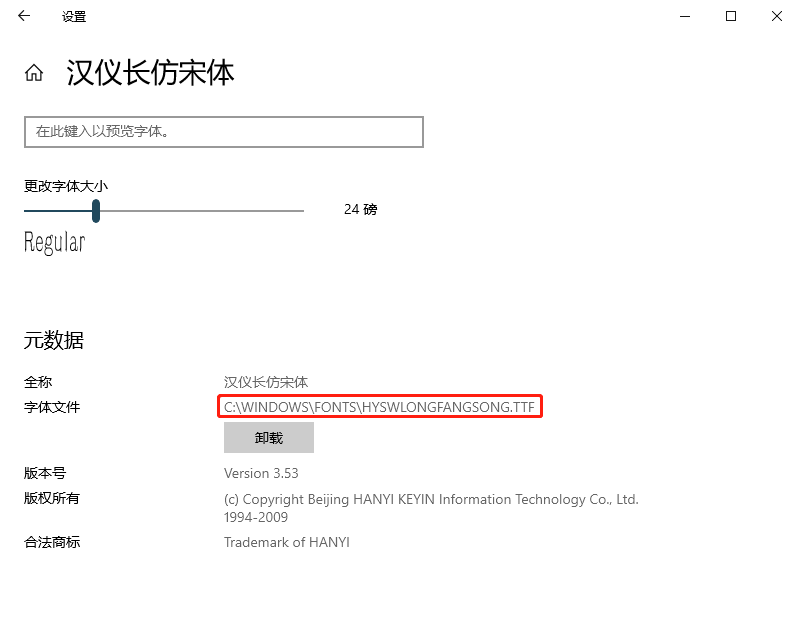
Next, we output the font name of the specified font:
for I in FONT_SET: # FONT_SET to see the code above
         if i [0] == 'C: \\ Windows \\ fonts \\ hyswlongfangsong.ttf': # match the path in font_set
        print(i[1])
        break
Output results:
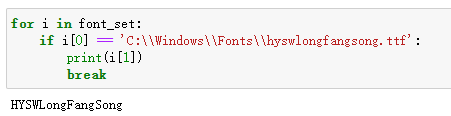
The font name is [Hyswlongfangsong]
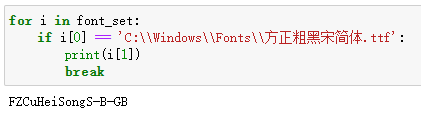
The file name you see here is not necessarily the font name, such as [Founder Rough Black Song Simplified .TTF] is [fzcuheisongs-B-GB]
Set the code of the corresponding font is plt.rcparams ['font.family'] = ['Hyswlongfangsong']
Also pay attention to the font only supports specific language If we want to show Chinese, we must choose a font that supports Chinese
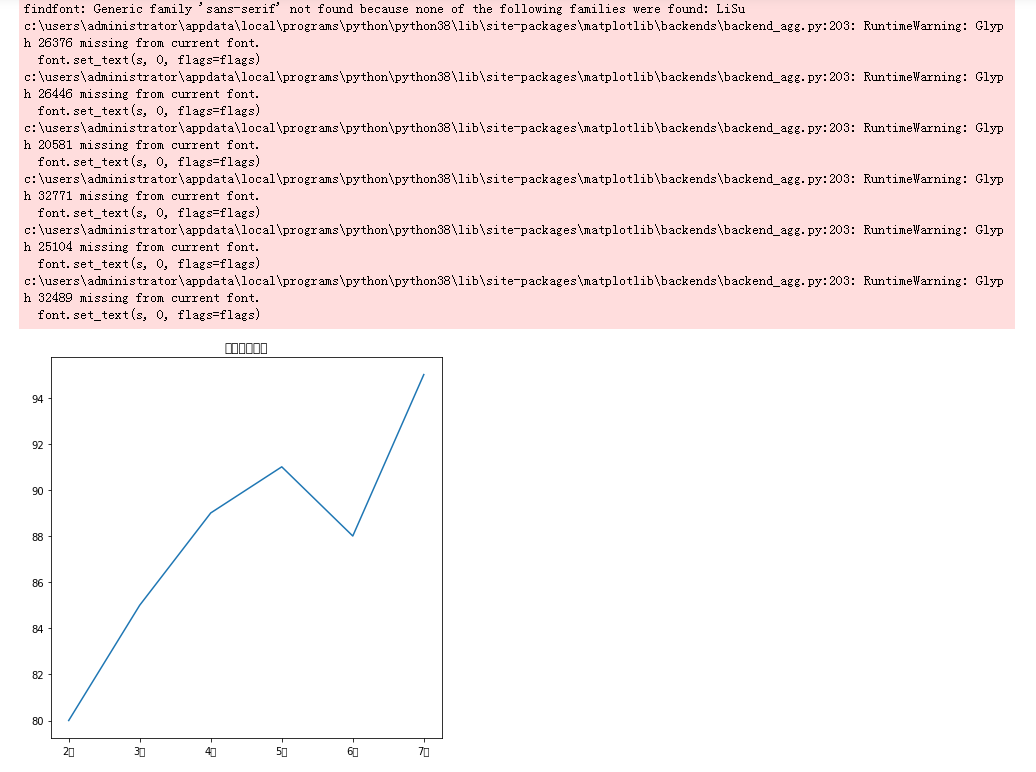
3. Look at the effect:
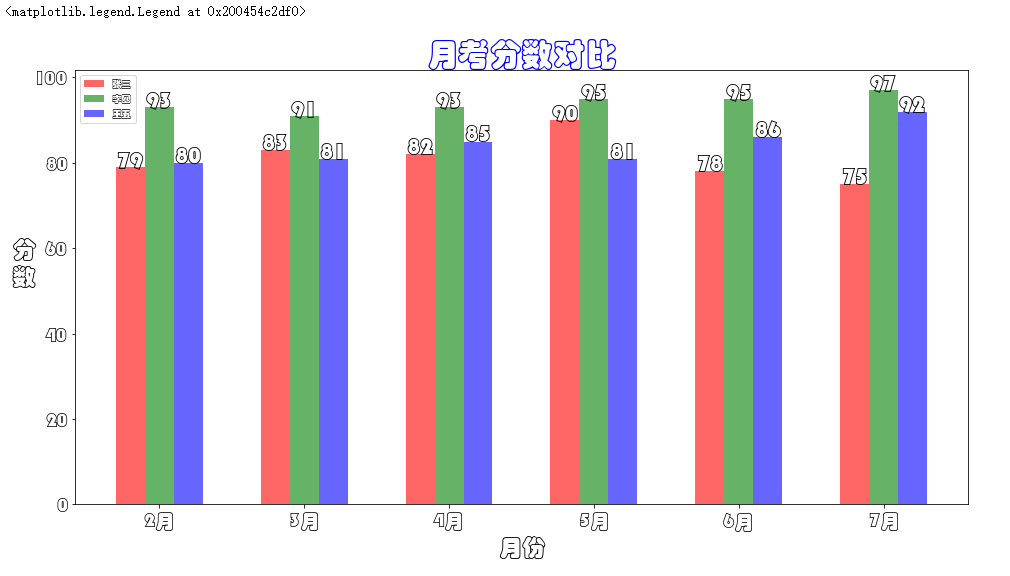
import pandas as pd
import matplotlib.pyplot as plt
plt.rcParams['font.family'] = ['HYSWLongFangSong']
 # Create three student performance data
 Students_grade = pd.dataFrame ({'Zhang San': [79, 83, 82, 90, 78, 75],
                                                               'Li Si': [93, 91, 93, 95, 95, 97],
                                                               'Wang Five': [80, 81, 85, 81, 86, 92]
                              })
 # Definition canvas size
plt.figure(figsize=(16, 8))
 # Set the title
 PLT.TITLE ('monthly test score comparison', fontsize = 32, color = 'blue')
 # Set the column color
colors = ['r','g','b']
 # Define the X -axis label list
 month = ['February', 'March', 'April', 'May', 'June', 'July']
 # Define the list of student names
name_list = students_grade.columns
 # Create three students' grades
for i in range(3):
         # (X -axis position, column height, column color, pillar width, column transparency)
    plt.bar(students_grade.index + 0.2*(i-1), students_grade[name_list[i]].values,
 color = colors[i] , width = 0.2, alpha = 0.6)
         # Set the scale name
         PLT.XTICKS (Students_grade.index, MONTH, FONTSIZE = 20) # Location, value, font size
    plt.yticks(fontsize=20)
         # Set the coordinate shaft tag
         PLT.XLabel ('month', fontsize = 24)
         #, Font size, rotation angle (default 90 °)
         PLT.YLabel ('division \ n number', fontsize = 24, rotation = 0)
         # Set data tag
    for a,b in zip(students_grade.index, students_grade[name_list[i]].values):
                 # X -axis position, Y axis position, value, alignment method, font size
        plt.text(a + 0.2*(i-1), b, b, ha='center', fontsize = 24)
 # Settlement legend
plt.legend(name_list)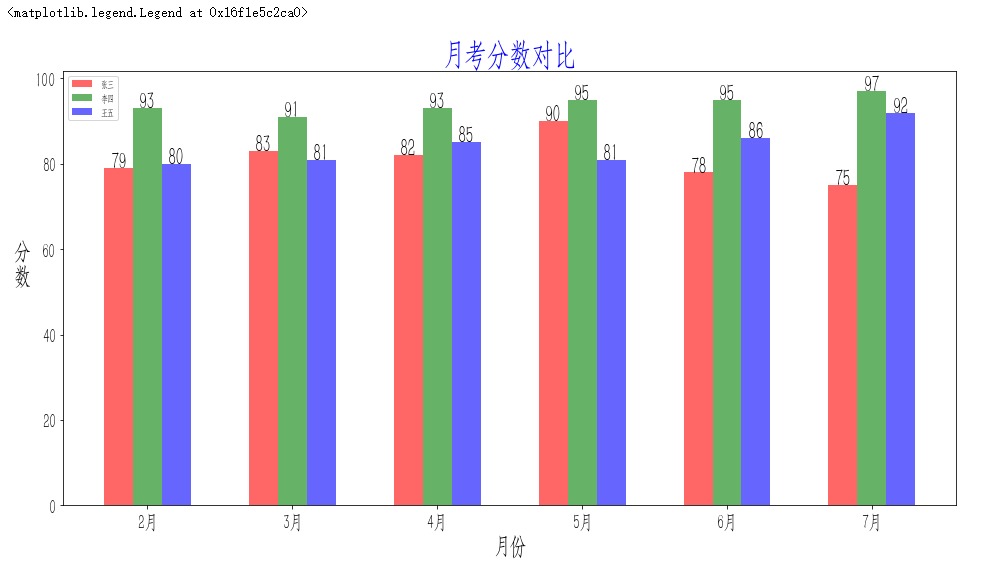
4. Install new fonts
For example, my Windows system has no [Source Han Sans CN], [Chinese Caiyun] and other fonts.Character networkAfter downloading it, unzip the font and drag to the installation of C: \ Windows \ Fonts directory. But at this time, the font still could not be found in the Matplotlib font. At this time, we need to clean the font cache of the Matplotlib.
You can use the following code
import matplotlib as plt
plt.get_cachedir()
Output Matplotlib font cache Directory: C: \ Users \ Administrator \. Matplotlib. My cache is in this directory.
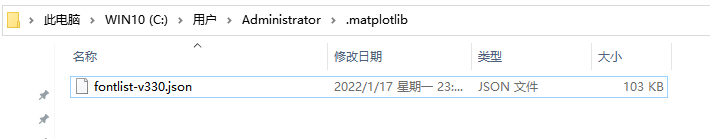
Delete this directory and exit the editor currently in use such as Jupyter. The next startup editor to import the Matplotlib library will generate this cache folder again. When you set the font again, this font cache file will be automatically generated.
Let's take a look
Intelligent Recommendation
Python matplotlib Chinese display garbled
Problem Description: When using the python drawing package matplotlib, I found that sometimes the legend and other settings cannot display Chinese normally. the reason: Roughly, there are no Chinese f...

Drawing with matplotlib in Mac, Chinese display garbled
(1) Download Microsoft Yahei font download link http://www.pc6.com/mac/116742.html The font is added to the Mac local font book, specific referencehttp://www.pc6.com/edu/67330.html The font is added t...
MATPLOTLIB drawing display Chinese garbled solution
Each additional code scheme Add a line of code when drawing Modify the configuration file, permanently solve Chinese display problems My windows10 + py2.7 is not successful! OH, FUCK...
matplotlib drawing using Chinese fonts
First you need to install fonts, willhttps://github.com/tracyone/program_fontDownload, after downloading the fonts in / usr / share / fonts / below Use fc-list: lang = zh see those fonts you can use I...
Chinese garbled in matplotlib drawing
In ipython notebook, when we use matplotlib for drawing, Chinese will not be displayed. As shown This is because matplotlib default font does not support Chinese characters, so it needs to be modified...
More Recommendation
MATPLOTLIB drawing Chinese garbled
Input in the packetplt.rcParams[“font.sans-serif”] = [“SimHei”] After remember that you can't entered when drawing latersns.set(style=“whitegrid”)Otherwise, the plt...
matplotlib drawing does not display Chinese problem
By default, matplotlib does not use Chinese fonts and needs to modify the configuration file 1. Find the configuration file in the python installation directory: such as D:\soft\python\Lib\site-packag...
MATPLOTLIB drawing does not display Chinese (solution)
Question: Draw more when drawing with a Matplotlib, but a box. Solution: 1. Enter the following code: View C: \ Users \ ... \ python \ python38 \ site-packages \ matplotlib \ MPL-DATA \ FONTS \ TFF ha...
Python drawing toolkit matplotlib Chinese garbled problem
Find the \Lib\site-packages\matplotlib\mpl-data\matplotlibrc file in the python installation directory. Display Chinese Change to: Normal display of positive and negative signs Change to:...
Python matplotlib drawing Chinese garbled problem solving
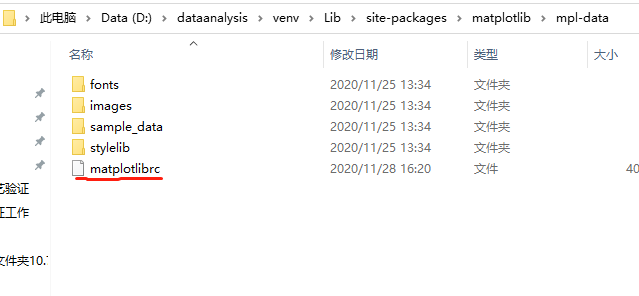
Chinese garbled solutions in matplotlib drawing step 1 Find the matplotlibrc file in the matplotlib library package under the project, mine is in D:\dataanalysis\venv\Lib\site-packages\matplotlib\mpl-...