[ECG signal] ECG peak detection with Matlab code
tags: signal processing matlab Development language
1 Introduction
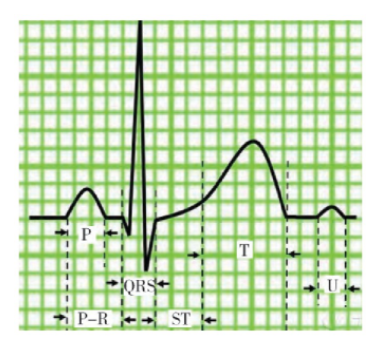
This paper relates to a method for detecting the peak value of an electrocardiogram waveform, comprising the following steps: preprocessing the electrocardiogram waveform; calculating the cosine value of the sampling point of the electrocardiogram waveform to obtain a triangular cosine sequence; detecting the peak position according to the triangular cosine sequence; The position is corrected and confirmed, and points that are not peaks are excluded. This article also involves a peak detection system for ECG waveforms. This article can quickly and accurately detect the peak position of the ECG waveform, especially the QRS wave, and effectively reduce the workload of doctors.
2 part code
%% SOLUTION 4:
clc;
clear all;
close all;
ecg=load('12-2-2016 17.53.13.txt');
f_s=250;
N=length(ecg);
t=[0:N-1]/f_s; %time period(total sample/Fs )
figure
plot(t,ecg,'r'); title('Raw ECG Data plotting ')
xlabel('time')
ylabel('amplitude')
w=50/(250/2);
bw=w;
[num,den]=iirnotch(w,bw); % notch filter implementation
ecg_notch=filter(num,den,ecg);
[e,f]=wavedec(ecg_notch,10,'db6');% Wavelet implementation
g=wrcoef('a',e,f,'db6',8);
ecg_wave=ecg_notch-g; % subtracting 10th level aproximation signal
%from original signal
plot(rr4,rr5,'r*') %plot R-R(n)(X-Axis) vs R-R(n-1)(Y-Axis)
title('POINCARE PLOT'), xlabel('RR(n+1)') ,ylabel('RR(n)')
%% Task 4-b
ki=length(rr3) ;
ahr=mean(hr); % mean heart rate;
disp(['mean hrv = ' num2str(ahr)]);
% disp is used to display the value(s);
SDNN = std(rr3);
% SDNN, standard deviation for RR interval used in statical analysis;
disp(['SDNN = ' num2str(SDNN)]);
sq = diff(rr3).^2;
rms = sqrt(mean(sq)); % RMSSD,
disp(['RMSSD = ' num2str(rms)]);
% RMS difference for RR interval used in statical analysis;
NN50 = sum(abs(diff(rr3))>.05);
% NN50 no. of pairs of RR that is more than 50, used in statical analysis;
disp(['NN50 = ' num2str(NN50)]);
%% Try 4/3
%figure,
%comet(ecg_smooth(1:1000))
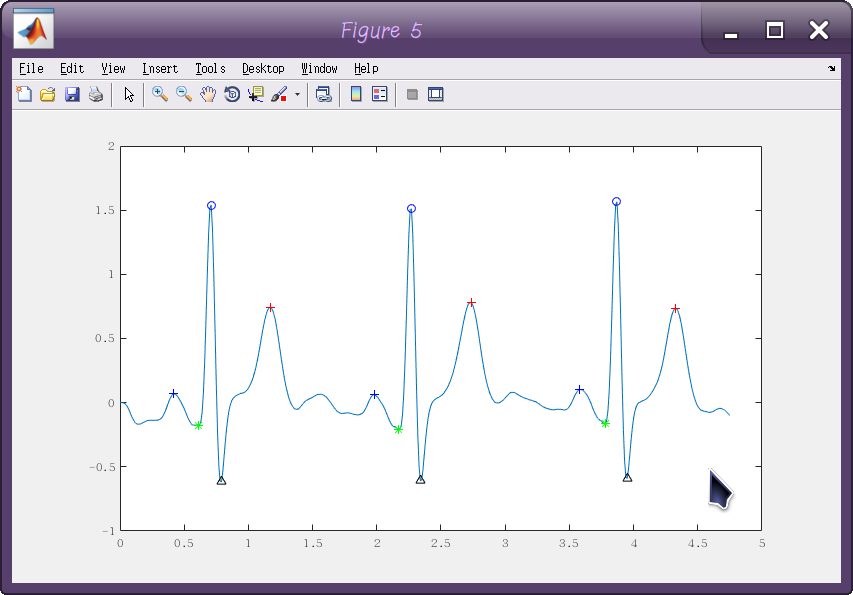
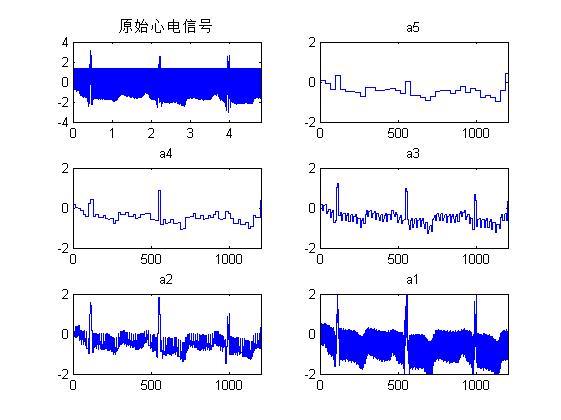
3 Simulation results


4 References
[1] Zhang Gaodeng, Dong Jun. Electrocardiogram waveform peak detection method and system:, CN104939821A[P].
Introduction to the blogger: Good at Matlab simulation in various fields such as intelligent optimization algorithm, neural network prediction, signal processing, cellular automata, image processing, path planning, drone, etc. You can communicate with Matlab code in private.
Some theories cite online literature, if there is any infringement, contact the blogger to delete it.

Intelligent Recommendation

[ECG] Based on MATLAB ECG Signal Collection and Process [with MATLAB Source 954]
First, introduction 1 heart sound: The sound generated when the heart shrinks, the ears or stethoscope can be heard in the chest wall, or the electronic instrument can be recorded (heart ". It ca...
PQRST simulation matlab code of ECG signal (reproduced + own research summary)
There are currently two codes available on the PQRST website [1][2] We use [2] because of the lowpass function used in [1]. Mentioned in [3]:"Note that only matlab after 2018 has lowpass and band...
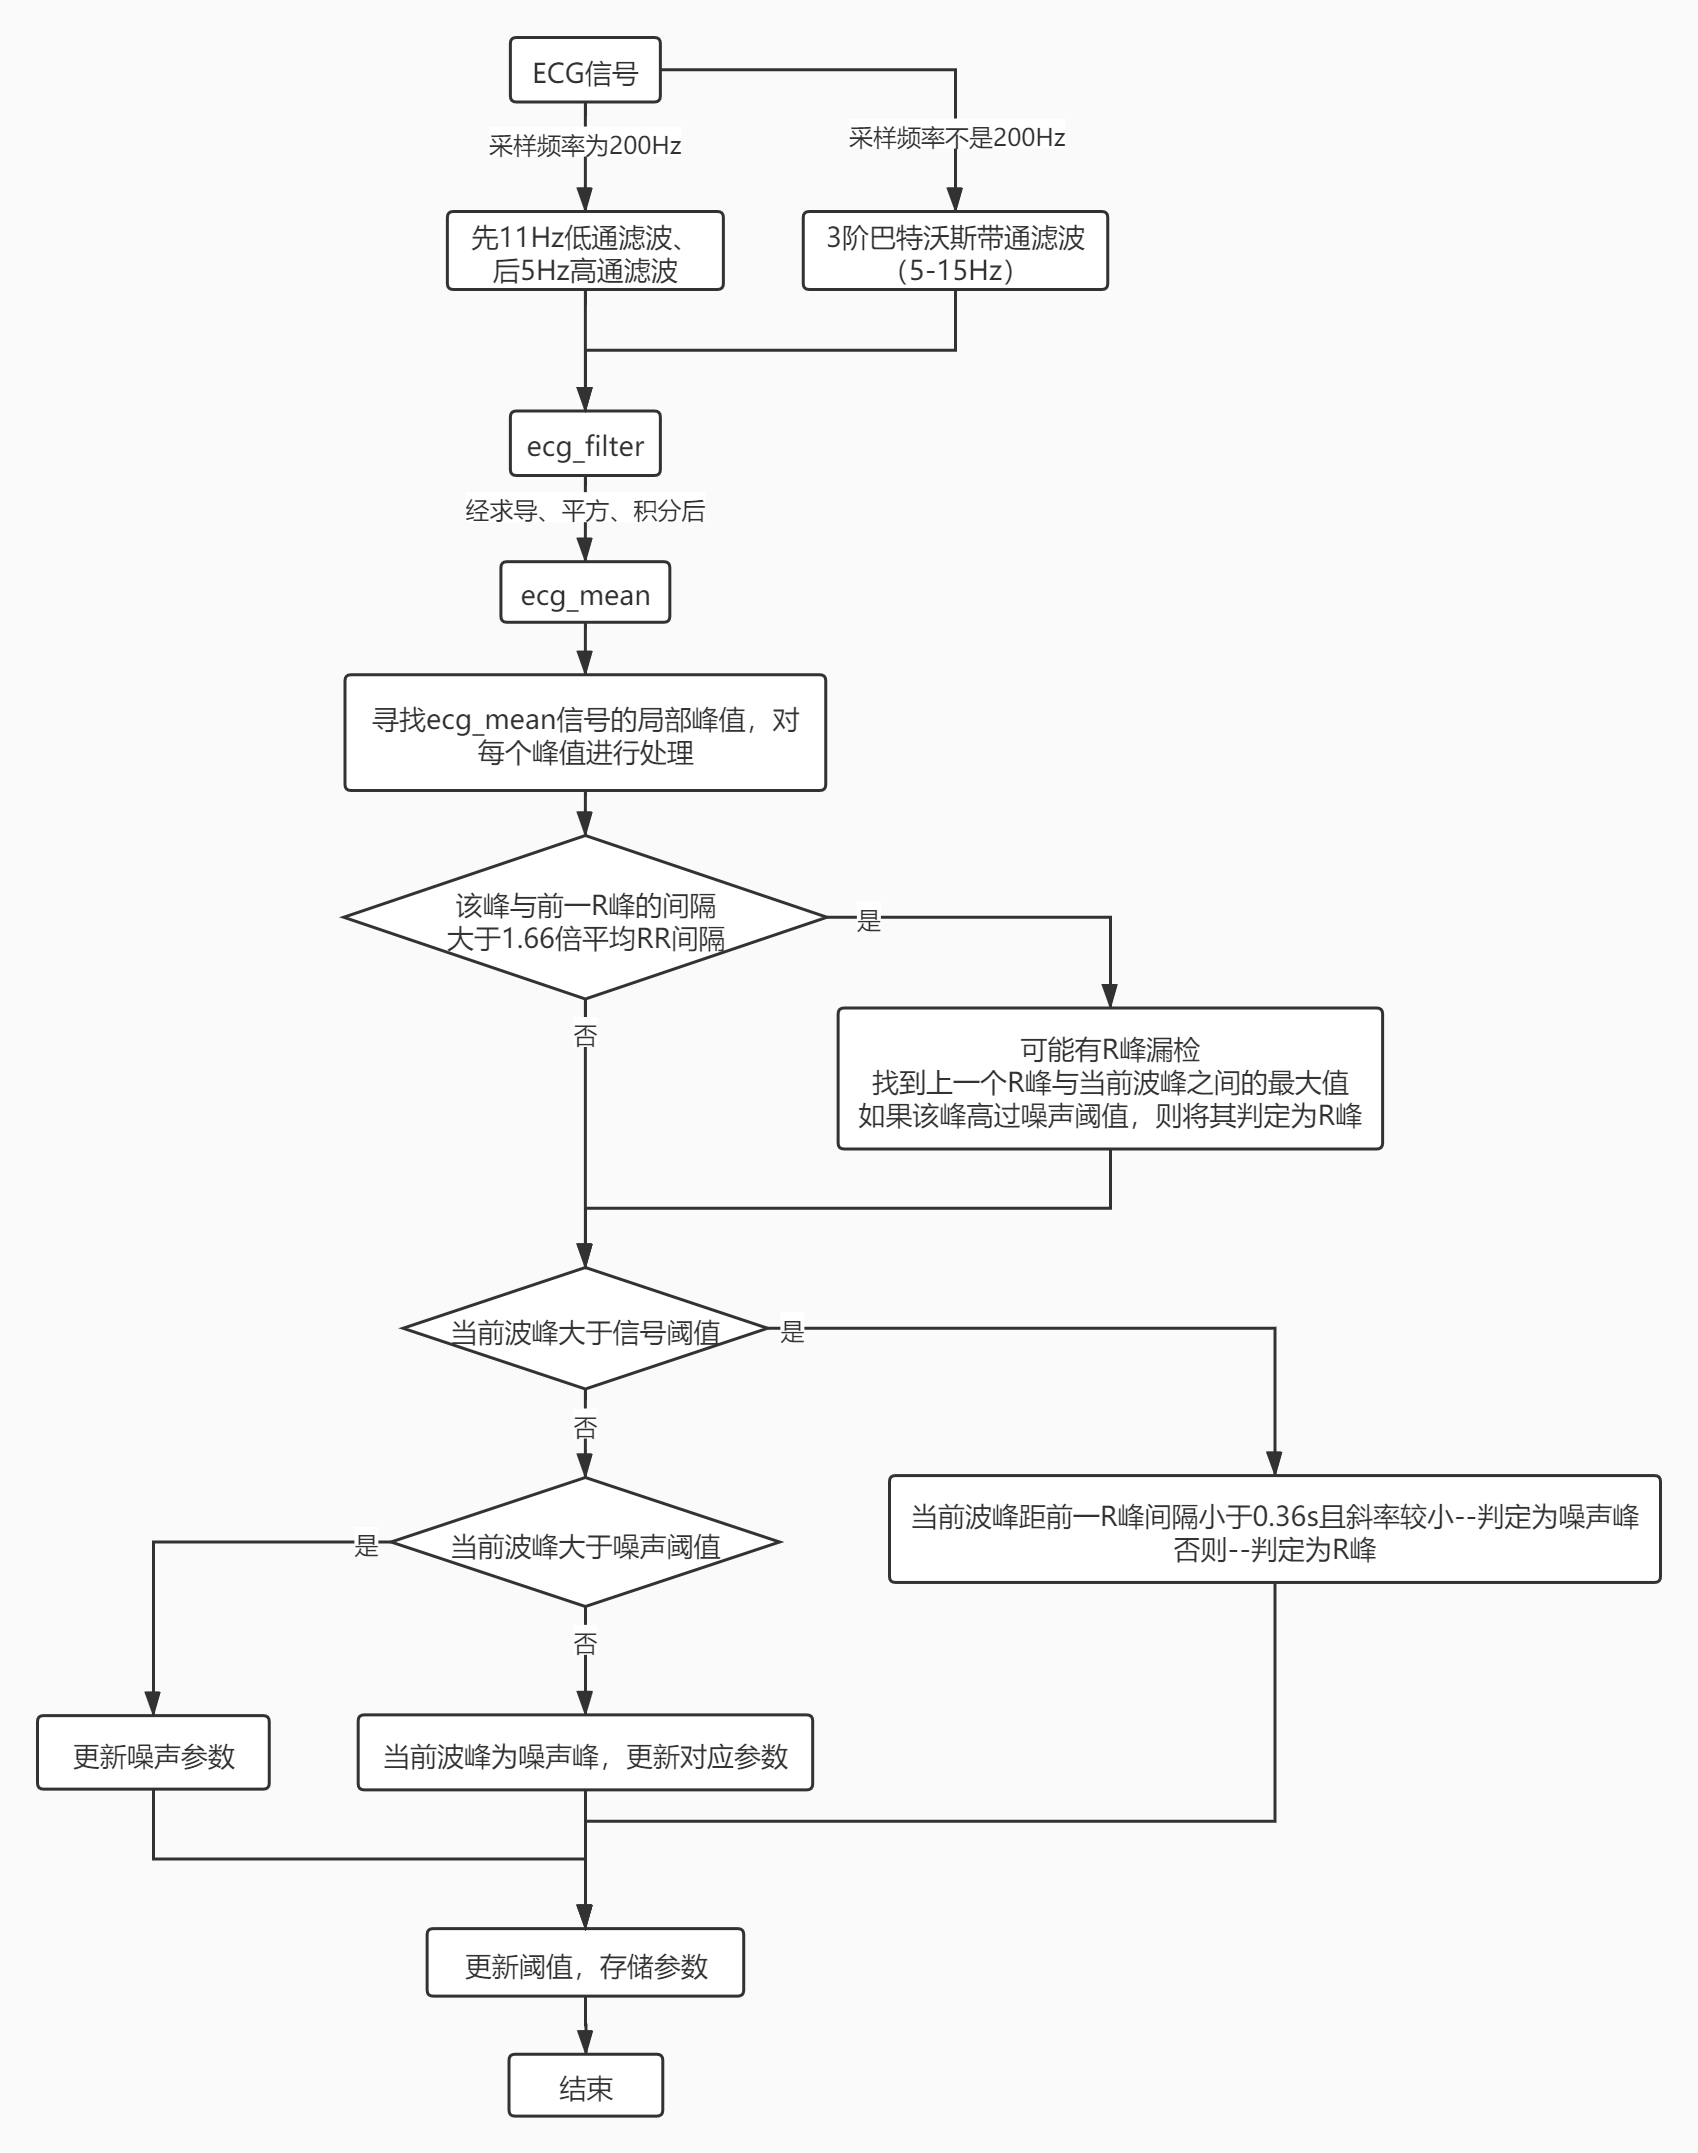
ECG signal QRS peak detection: a real-time QRS Detection Algorithm (PAN-TomPKins)
The Pan-Tompkins method is a classic method for R peak detection, which is attributes up to 6000+ times. Pan J, Tompkins W J. A real-time QRS detection algorithm[J]. IEEE transactions on biomedical en...
[ECG signal] Based on the MATLAB GUI adaptive filtering+smooth filter+wavelet filter ECG signal processing [Contains MATLAB Source Code 1809 period]
1. Introduction to ECG signal processing 1 Introduction ECG is a basic human physiological signal and has important clinical diagnostic value. It is characterized by a weak signal and a small signal -...
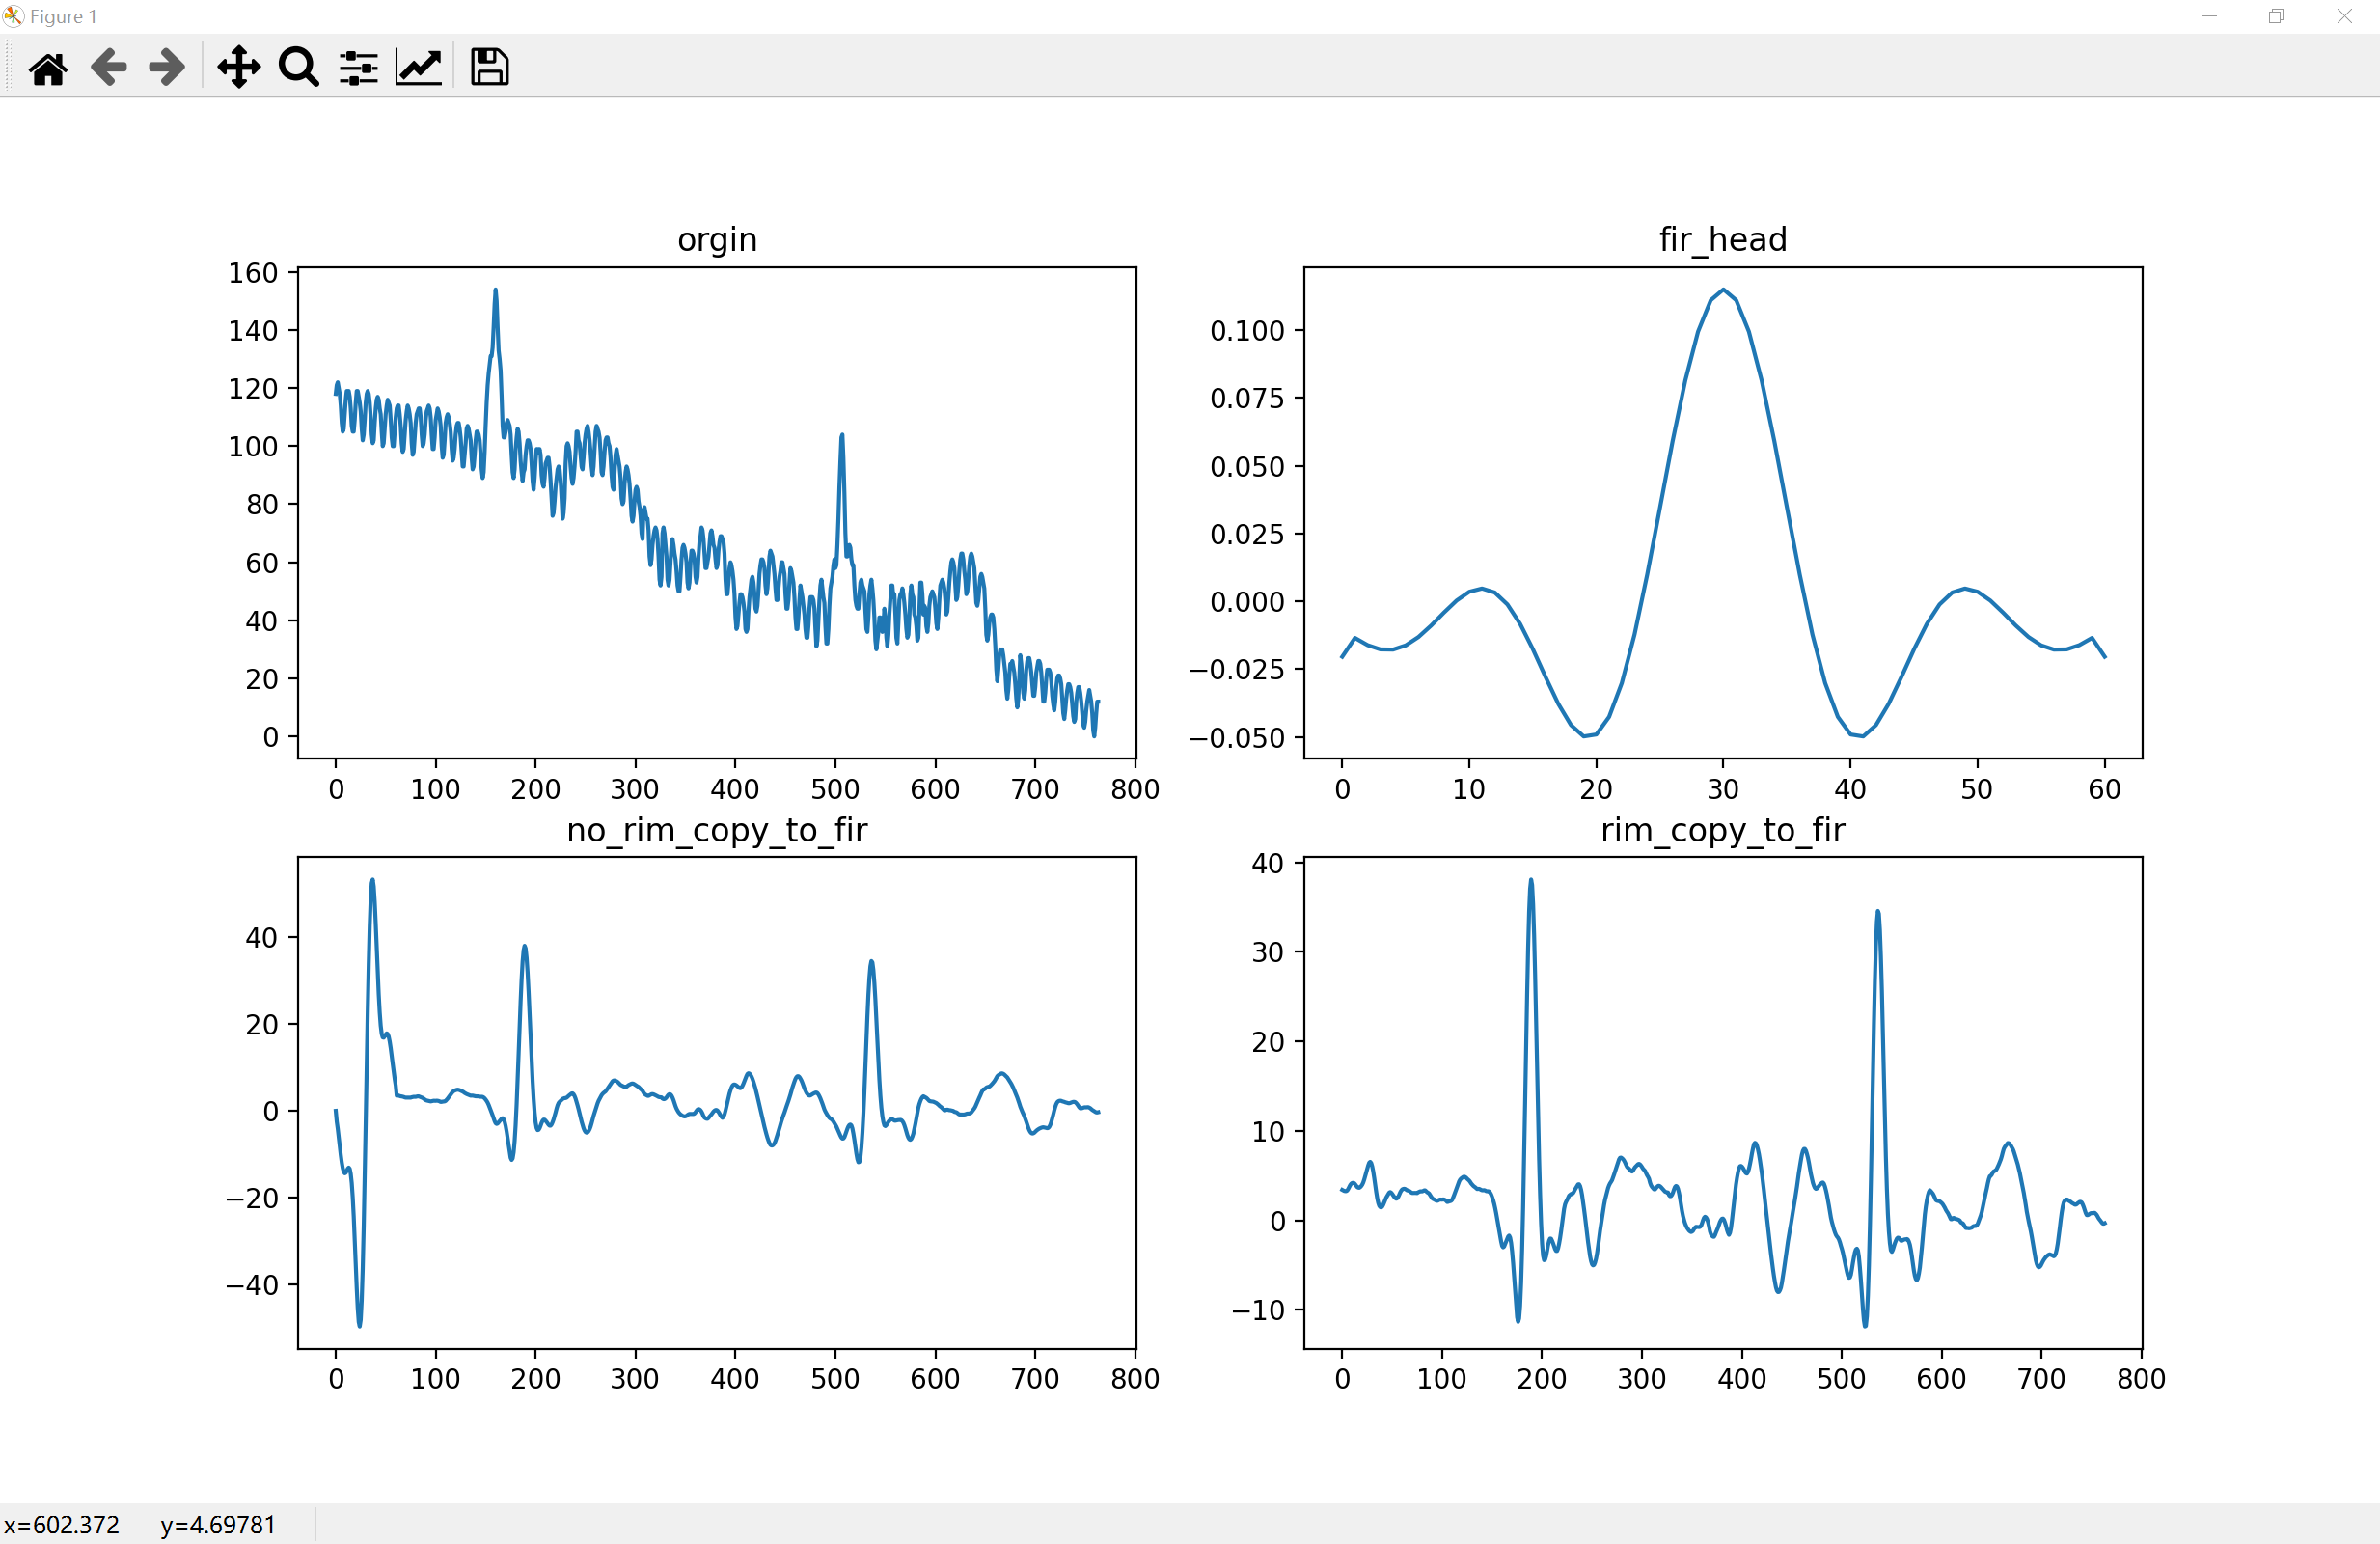
ECG ECG signal processing - FIR
Preventing boundary value mutations can be repeated using boundaries Document can see my resources Picture to test with other data...
More Recommendation

2.matlab absolute difference value of ECG signal
According to the referencehttps://max.book118.com/html/2015/0314/13288410.shtmMake a difference in page 159, take the absolute value, and perform three-point smoothing. inData=load('D:/lV3-1mv-src.xls...

Realization of ECG signal processing based on MATLAB
Original source This is the original code, it cannot run after copying directly, it shows that M and TIME are not defined. Need a ramat function to read the ECG data. First download the ECG data, addr...
[ECG signal] Based on MATLAB HAAR small wave transformation electricity signal denoising [including MATLAB source code 956]
First, introduction 1 heart sound: The sound generated when the heart shrinks, the ears or stethoscope can be heard in the chest wall, or the electronic instrument can be recorded (heart ". It ca...
[ECG signal] Based on MATLAB NLM Time Series Card Energy Signal Delivery [including MATLAB Source Code 1547]
First, the electrocardiographic signal introduction 0 Preface The electrocardiographic signal is one of the first biological signals earliest, compared to other biological signals, and it has an intui...

[ECG signal] Based on MATLAB GUI ECG signal preprocessing [including MATLAB source 938]
First, introduction 1 heart sound: The sound generated when the heart shrinks, the ears or stethoscope can be heard in the chest wall, or the electronic instrument can be recorded (heart ". It ca...