OpenGL study notes: drawing points, lines and polygons (Lesson 1)
mineOperating environment:
CentOS7
g++ (GCC) 4.8.5 20150623 (Red Hat 4.8.5-16)
OpenGL implementation vendor name: VMware, Inc.
 Renderer identifier: Gallium 0.4 on llvmpipe (LLVM 3.9, 256 bits)
 OpenGL implementation version number: 2.1 Mesa 17.0.1
OGLU tool library version: 1.3E.g:
glVertex2d
glVertex2f
glVertex3f
glVertex3fv
The letters indicate the type of parameter,
s represents a 16-bit integer (this type is defined as GLshort in OpenGL),
i represents a 32-bit integer (this type is defined as GLint and GLsizei in OpenGL),
f represents a 32-bit floating point number (this type is defined as GLfloat and GLclampf in OpenGL),
d represents a 64-bit floating point number (this type is defined as GLdouble and GLclampd in OpenGL). A
v means that several parameters passed will use pointers, see the example below. A
These functions are the same except for the type and number of parameters.
For example, the functions of the following five code segments are equivalent:
(1) glVertex2i(1, 3);
 (2) glVertex2f(1.0f, 3.0f);
 (3) glVertex3f(1.0f, 3.0f, 0.0f);
 (4) glVertex4f(1.0f, 3.0f, 0.0f, 1.0f);
 (5) GLfloat VertexArr3[] = {1.0f, 3.0f, 0.0f};
glVertex3fv(VertexArr3);E.g:
glBegin(GL_POINTS);
glVertex2f(0.0f, 0.0f);
glVertex2f(0.5f, 0.0f);
glEnd(); If you replace GL_POINTS with GL_LINES, the two points will be considered as the two endpoints of the line, and OpenGL will draw a line. We can also specify more vertices, and then draw more complex graphics. A
On the other hand, in addition to GL_POINTS and GL_LINES, glBegin supports GL_LINE_STRIP, GL_LINE_LOOP, GL_TRIANGLES, GL_TRIANGLE_STRIP, GL_TRIANGLE_FAN, etc. The general effect of each method is shown in the following figure:
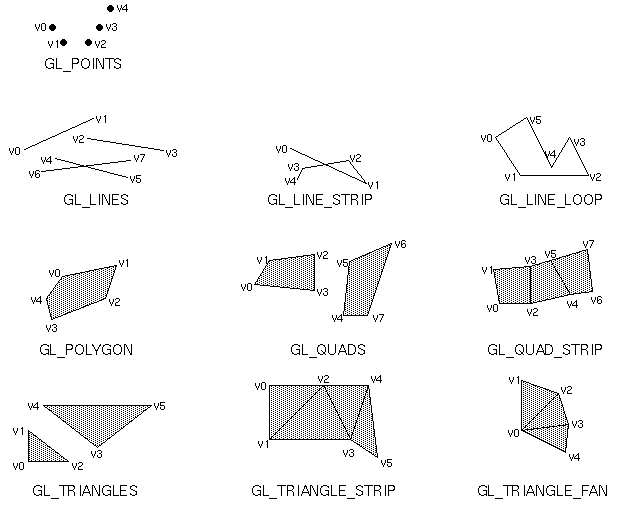
Disclaimer: The picture is from www.opengl.org, the picture is a drawing of the book "OpenGL Programming Guide" .
The following is simply givenSource code:
/**
* "Introduction to OpenGL"
* Point, line and polygon
*/
#include <GL/glut.h>
#include <math.h>
const int n = 200;
const float R = 0.5;
const float Pi = 3.1415926536;
/*Draw a circle*/
void myDisplay1(void)
{
int i;
float x,y;
glClear(GL_COLOR_BUFFER_BIT);
glBegin(GL_POLYGON);
for(i=0; i<n; ++i)
{
x = R*cos(2*Pi/n*i);
y = R*sin(2*Pi/n*i);
glVertex2f(x, y);
}
glEnd();
glFlush();
}
/*Draw a five-pointed star*/
/* First, according to the cosine theorem, set the equation,
Calculate the distance a from the center of the five-pointed star to the vertex a (assuming that the side length of the five-pointed star corresponding to a regular pentagon is .0)
a = 1 / (2-2*cos(72*Pi/180));
Then, according to the definition of sine and cosine, calculate the x coordinate bx and y coordinate by,
And the y coordinate of C (assuming the center of the five-pointed star is at the origin of the coordinate)
bx = a * cos(18 * Pi/180);
by = a * sin(18 * Pi/180);
cy = -a * cos(18 * Pi/180);
The coordinates of the five points can be simply expressed by the above four quantities and some constants */
void myDisplay2(void)
{
GLfloat a = 1 / (2-2*cos(72*Pi/180));
GLfloat bx = a * cos(18 * Pi/180);
GLfloat by = a * sin(18 * Pi/180);
GLfloat cy = -a * cos(18 * Pi/180);
GLfloat PointA[2] = { 0, a },
PointB[2] = { bx, by },
PointC[2] = { 0.5, cy },
PointD[2] = { -0.5, cy },
PointE[2] = { -bx, by };
glClear(GL_COLOR_BUFFER_BIT);
// In the order of A->C->E->B->D->A, you can draw the five-pointed star in one stroke
glBegin(GL_LINE_LOOP);
glVertex2fv(PointA);
glVertex2fv(PointC);
glVertex2fv(PointE);
glVertex2fv(PointB);
glVertex2fv(PointD);
glEnd();
glFlush();
}
/*Draw the graph of the sine function */
/* Since the default coordinate value of OpenGL can only be from -1 to 1,
(Can be modified, but the method will be discussed later) So we set a factor,
Reduce all coordinate values in proportion, so that you can draw more sine cycles
Try to modify the value of factor and observe the changes */
const GLfloat factor = 0.1f;
void myDisplay3(void)
{
GLfloat x;
glClear(GL_COLOR_BUFFER_BIT);
glBegin(GL_LINES);
glVertex2f(-1.0f, 0.0f);
glVertex2f(1.0f, 0.0f); // The above two points can draw the x axis
glVertex2f(0.0f, -1.0f);
glVertex2f(0.0f, 1.0f); // The above two points can draw the y-axis
glEnd();
glBegin(GL_LINE_STRIP);
for(x=-1.0f/factor; x<1.0f/factor; x+=0.01f)
{
glVertex2f(x*factor, sin(x)*factor);
}
glEnd();
glFlush();
}
int main(int argc, char *argv[])
{
/*Initialization*/
glutInit(&argc, argv);
/*Set display mode: RGB color, single buffer*/
glutInitDisplayMode(GLUT_RGB | GLUT_SINGLE);
/*Set in the center of the window*/
glutInitWindowPosition(100, 100);
/*Set the window size*/
glutInitWindowSize(200, 200);
/*Create window*/
glutCreateWindow("Paint1");
/*Set a function*/
glutDisplayFunc(&myDisplay1);
/*Create window*/
glutCreateWindow("Paint2");
/*Set a function*/
glutDisplayFunc(&myDisplay2);
/*Create window*/
glutCreateWindow("Paint3");
/*Set a function*/
glutDisplayFunc(&myDisplay3);
/*Perform a message loop*/
glutMainLoop();
return 0;
}Compile and run:
$ make
gcc test.c -lGL -lglut -lGLU -lXmu -Bstatic -Bdyanmic -lm
./a.out
In the end, three windows will pop up, draw a circle, a five-pointed star and a sine function:

Code and content come from"OpenGL Tutorial (Fine)", If there is any infringement, please contact to delete.
Intelligent Recommendation

OpenGL study notes-drawing primitives
Primitive Primitive, the graphic element, is the smallest graphic unit that can be edited. The primitive is the most basic material used by the graphics software to operate and organize the screen. A ...
OpenGL study notes: drawing images
reference:Start learning OpenGL ES by displaying a picture After studying opengl for a period of time (learned to draw a triangle...), I found that drawing graphics requires given vertex coordinates, ...
OpenGL study notes (1) OpenGL
OpenGL is consideredAPI(Application Programming Interface, Application programming interface), Contains a series of functions that can operate graphics and images. However, OpenGL itself is not an API...
LaTeX study notes (1)-drawing key points
Preface If you are not satisfied with Word's typesetting effect? Does the submitted journal require LaTeX typesetting? Let us see the power of LaTeX through an example! ∑ p prime f ( p ) = &...
Cesium development study notes (6) --- draw lines, draw polygons
Refer to this great god: Draw a line Draw polygon This note is just to record what you have learned in the project. If you have any questions, you can raise them and we can discuss them together....
More Recommendation
ArcGis displays points, lines, and polygons
Add a graphic overlay to the map view In the fileapp > java > {your.package.name} > MainActivity.java, create a new member variable to save the pairGraphic overl...

OpenGL study notes (1)
introduction byLearnOpenGL Learning OpenGL, I will refer to the knowledge that I think is more important. About OpenGL 1. What is OpenGL: OpenGL itself is not an APIIt is just a specification develope...
Study notes (111): The basics of R language introduction-polygon drawing polygons
Learn now: The Ploygon function adds polygons to the graph polygon(x,y,…) Take the data (x,y) as the coordinates, connect all the points in turn, and draw a polygon Corresponding results...