Use the regress regression analysis in matlab to fit the surface (get the equation coefficients) and the residual graph
Today I have to use matlab to fit the surface. It takes at least three points to determine a face. With two points, there are multiple sides.
Use the regress regression analysis in matlab to fit the surface (get the equation coefficients) and the residual graph.
The matlab code is as follows:
% Sample data, freely compiled
a1 = 76 ;b1 = 72 ;
a2 = 59 ;b2 = 113;
a3 = 48 ;b3 = 63 ;
a4 = 66 ;b4 = 158;
a5 = 92 ;b5 = 166;
z0 = 20;
% Note that the column vector is required
x = [a1, a2, a3, a4]'; % [76;59;48;66]
y = [b1, b2, b3, b4]'; % [72;113;63;158]
z = [z0-0.1, z0, z0-0.2, z0+0.1]'; % [19.90;20;19.80;20.10]
k = length(x);% returns the total number of samples
X=[ones(k,1) x y];% where there are n data, fill in ones(n,1)
% X: [1,76,72;1,59,113;1,48,63;1,66,158]
% Call regression function to find model parameters
[b, bint, r, rint, stats] = regress(z,X);
% Get the 95% confidence interval bint of parameter b,
% Residual r and residual 95% confidence interval rint,
% stats has a vector of three components, which are the coefficient of determination R-squared, F-value, and regression p-value.
% Draw a picture of known points
figure(1)
scatter3(x, y, z, '*');
hold on
% Regression result b: [19.5255;0.0024;0.0027], that is, z = 19.5255 + 0.0024*x + 0.0027*y
p00=b(1);
p10=b(2);
p01=b(3);
% Make a regression surface, suppose we make a surface with a range of 150x100
m = 150; n =100;
data = ones(m,n);
for i = 1:m
for j = 1:n
data(i,j)= p00 + p10*i + p01*j;
end
end
Z = data;
[X,Y]=meshgrid(1:1:n,1:1:m);
% Visualization
surf(X,Y,Z);
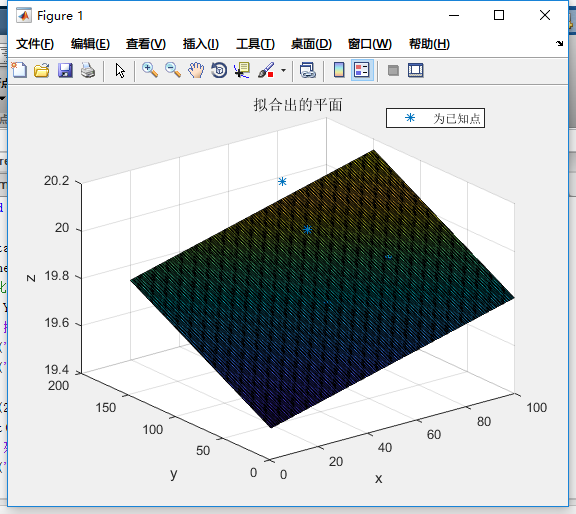
title('Fit the plane')
xlabel('x'); ylabel('y'); zlabel('z');
legend('is a known point')
figure(2);
rcoplot(r, rint);% Make residual plot
title('Residual graph drawing');
xlabel('data'); ylabel('residuals');The regression analysis fitting surface is shown in the figure below:


Intelligent Recommendation
[matlab]Multiple linear regression-regress function usage
Reprint the original address of the blog: regression analysis Regression Analysis (English: Regression Analysis) is a method of statistically analyzing data. The purpose is to understand whether two o...
Matlab multiple linear regression regress and fitting polyfit
1. Linear regression: As the name implies, regress is the fitting of one-variable multivariate equations, y=c1*x1+c2*x2...or y=c1*x1^2+c2*x2^2+c3*x1*x2....etc. Equal form funcPara=[ones(size(y,2))' x1...

Regression prediction analysis (RANSAC, polynomial regression, residual graph, random forest)
In this article, I mainly introduce some methods of using Boston housing price data to master regression forecast analysis. Through this article you can learn: 1. Important features of visualized data...
[Mathematical Modeling] Multi-linear regression analysis Regress, MATLAB code [21.8.5-8.7]
[Mathematical modeling] Scatter Draw Point Figure, Scatter3 painting 3D scatter map, MSHGRID grid coordinate, MESH painting network grid map MATLAB ---- Common Return Analysis Matlab Command (Regress)...
Use of PostgreSQL regression test tool regress
Regression testing is one of PostgreSQL's testing methods. For regression testing, you need to define the test script in advance (usually SQL script, placed in the sql directory), and define the expec...
More Recommendation
matlab regress()
regress() b = regress(y,X) [b,bint] = regress(y,X) [b,bint,r] = regress(y,X) [b,bint,r,rint] = regress(y,X) [b,bint,r,rint,stats] = regress(y,X) [ ___ ] = regress(y,X,alpha) Vector B contains a predic...

How to use MATLAB to create multiple fit curves in a graph in a graph
The following is the implementation code for the original curve without fitting title Fit the graph below Click on the tool to basically fit the conformal interpolation. Select data1 in the selection ...
[MATLAB] One-variable linear regression (regress parameter test description)
Today I learned about statistical regression models. Statistical regression models are the most basic and commonly used data-driven models based on statistical theory. This blog post mainly explains t...

[MATLAB] Stepwise regression case-cement solidification model (regress+stepwise)
From the cement solidification model, explore the role of stepwise in modeling. This still needs to start with examples: The code is as follows: According to the Next Step in the figure, the line segm...
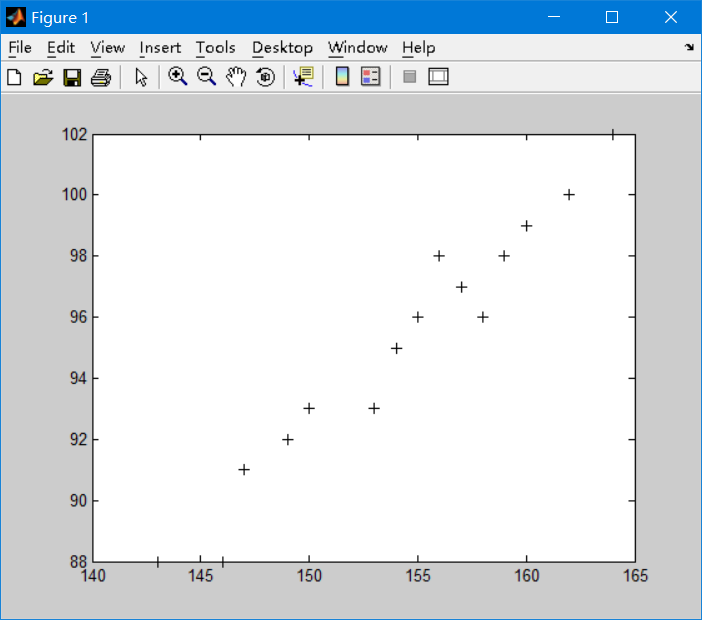
04, scatter plot, linear regression equation: solving regression coefficients
1. Scatter plot: a plot drawn based on actual results As shown: 2. Linear regression curve: According to the scatterplot, draw the approximate curve: y = a + bx a: Regression cardinality b: regression...