Debug segment error in Linux (core dumped)
Debug segment error in Linux (core dumped)
In the game, I often encounter a segmentation error, but generally use the stupid method of printf printing information, and the positioning bug is slow. Today, I try to use the gdb tool to debug the segmentation error.
Core dumped is generally caused by incorrect array index position, or the problem of array out of bounds. Programming in Linux environment should be easy to encounter.
GDB debugging specific process
Look at the data and find a few specific ways to talk about Core dump:
How to get a core dump for a segfault on Linux.
How to analyze a program's core dump file with gdb?.
Core dump file analysis [duplicate].
Debugging with GDB.
Linux Applications Debugging Techniques/Core files.
What is a segmentation fault (core dumped)
A segmentation error generally refers to a program attempting to access a memory address that it is not allowed to access, and may be caused by:
Trying to access (dereference) a null pointer, the system does not allow access to the memory space with address 0;
Trying to access a pointer that is not within its own memory access range;
In a C++ program, a class's vtable (a list of virtual pointers) is occupied and points to an error location, causing the program to attempt to execute an address that does not have permission to run;
Program access without memory alignment can also cause segmentation errors.
Valgrind simple tool for debugging
Valgrind can track some stack information of the program. You must use sudo apt-get install valgrind to install the command line tool before using it.
Then trace the problematic binary executable with the valgrind -v executable name.
The following is the result of the segmentation error program:
$ valgrind -v ./bin/CodeCraft-2019
==19578== Memcheck, a memory error detector
==19578== Copyright (C) 2002-2017, and GNU GPL'd, by Julian Seward et al.
==19578== Using Valgrind-3.13.0 and LibVEX; rerun with -h for copyright info
==19578== Command: ./bin/CodeCraft-2019
==19578==
--19578-- Valgrind options:
--19578-- -v
--19578-- Contents of /proc/version:
--19578-- Linux version 4.15.0-46-generic (buildd@lgw01-amd64-038) (gcc version 7.3.0 (Ubuntu 7.3.0-16ubuntu3)) #49-Ubuntu SMP Wed Feb 6 09:33:07 UTC 2019
--19578--
--19578-- Arch and hwcaps: AMD64, LittleEndian, amd64-cx16-rdtscp-sse3-avx
--19578-- Page sizes: currently 4096, max supported 4096
--19578-- Valgrind library directory: /usr/lib/valgrind
--19578-- Reading syms from /usrdata/applications/huawei2019/03-28-01-coredump/bin/CodeCraft-2019
--19578-- Reading syms from /lib/x86_64-linux-gnu/ld-2.27.so
--19578-- Considering /lib/x86_64-linux-gnu/ld-2.27.so ..
--19578-- .. CRC mismatch (computed 1b7c895e wanted 2943108a)
--19578-- Considering /usr/lib/debug/lib/x86_64-linux-gnu/ld-2.27.so ..
--19578-- .. CRC is valid
--19578-- Reading syms from /usr/lib/valgrind/memcheck-amd64-linux
--19578-- Considering /usr/lib/valgrind/memcheck-amd64-linux ..
--19578-- .. CRC mismatch (computed c25f395c wanted 0a9602a8)
--19578-- object doesn't have a symbol table
--19578-- object doesn't have a dynamic symbol table
--19578-- Scheduler: using generic scheduler lock implementation.
--19578-- Reading suppressions file: /usr/lib/valgrind/default.supp
==19578== embedded gdbserver: reading from /tmp/vgdb-pipe-from-vgdb-to-19578-by-jl-on-???
==19578== embedded gdbserver: writing to /tmp/vgdb-pipe-to-vgdb-from-19578-by-jl-on-???
==19578== embedded gdbserver: shared mem /tmp/vgdb-pipe-shared-mem-vgdb-19578-by-jl-on-???
==19578==
==19578== TO CONTROL THIS PROCESS USING vgdb (which you probably
==19578== don't want to do, unless you know exactly what you're doing,
==19578== or are doing some strange experiment):
==19578== /usr/lib/valgrind/../../bin/vgdb --pid=19578 ...command...
==19578==
==19578== TO DEBUG THIS PROCESS USING GDB: start GDB like this
==19578== /path/to/gdb ./bin/CodeCraft-2019
==19578== and then give GDB the following command
==19578== target remote | /usr/lib/valgrind/../../bin/vgdb --pid=19578
==19578== --pid is optional if only one valgrind process is running
==19578==
--19578-- REDIR: 0x401f2f0 (ld-linux-x86-64.so.2:strlen) redirected to 0x58060901 (???)
--19578-- REDIR: 0x401f0d0 (ld-linux-x86-64.so.2:index) redirected to 0x5806091b (???)
--19578-- Reading syms from /usr/lib/valgrind/vgpreload_core-amd64-linux.so
--19578-- Considering /usr/lib/valgrind/vgpreload_core-amd64-linux.so ..
--19578-- .. CRC mismatch (computed 4b63d83e wanted 670599e6)
--19578-- object doesn't have a symbol table
--19578-- Reading syms from /usr/lib/valgrind/vgpreload_memcheck-amd64-linux.so
--19578-- Considering /usr/lib/valgrind/vgpreload_memcheck-amd64-linux.so ..
--19578-- .. CRC mismatch (computed a4b37bee wanted 8ad4dc94)
--19578-- object doesn't have a symbol table
==19578== WARNING: new redirection conflicts with existing -- ignoring it
--19578-- old: 0x0401f2f0 (strlen ) R-> (0000.0) 0x58060901 ???
--19578-- new: 0x0401f2f0 (strlen ) R-> (2007.0) 0x04c32db0 strlen
--19578-- REDIR: 0x401d360 (ld-linux-x86-64.so.2:strcmp) redirected to 0x4c33ee0 (strcmp)
--19578-- REDIR: 0x401f830 (ld-linux-x86-64.so.2:mempcpy) redirected to 0x4c374f0 (mempcpy)
--19578-- Reading syms from /usr/lib/x86_64-linux-gnu/libstdc++.so.6.0.25
--19578-- object doesn't have a symbol table
--19578-- Reading syms from /lib/x86_64-linux-gnu/libgcc_s.so.1
--19578-- object doesn't have a symbol table
--19578-- Reading syms from /lib/x86_64-linux-gnu/libc-2.27.so
--19578-- Considering /lib/x86_64-linux-gnu/libc-2.27.so ..
--19578-- .. CRC mismatch (computed b1c74187 wanted 042cc048)
--19578-- Considering /usr/lib/debug/lib/x86_64-linux-gnu/libc-2.27.so ..
--19578-- .. CRC is valid
--19578-- Reading syms from /lib/x86_64-linux-gnu/libm-2.27.so
--19578-- Considering /lib/x86_64-linux-gnu/libm-2.27.so ..
--19578-- .. CRC mismatch (computed 7feae033 wanted b29b2508)
--19578-- Considering /usr/lib/debug/lib/x86_64-linux-gnu/libm-2.27.so ..
--19578-- .. CRC is valid
--19578-- REDIR: 0x547bc70 (libc.so.6:memmove) redirected to 0x4a2a6e0 (_vgnU_ifunc_wrapper)
--19578-- REDIR: 0x547ad40 (libc.so.6:strncpy) redirected to 0x4a2a6e0 (_vgnU_ifunc_wrapper)
--19578-- REDIR: 0x547bf50 (libc.so.6:strcasecmp) redirected to 0x4a2a6e0 (_vgnU_ifunc_wrapper)
--19578-- REDIR: 0x547a790 (libc.so.6:strcat) redirected to 0x4a2a6e0 (_vgnU_ifunc_wrapper)
--19578-- REDIR: 0x547ad70 (libc.so.6:rindex) redirected to 0x4a2a6e0 (_vgnU_ifunc_wrapper)
--19578-- REDIR: 0x547d7c0 (libc.so.6:rawmemchr) redirected to 0x4a2a6e0 (_vgnU_ifunc_wrapper)
--19578-- REDIR: 0x547bde0 (libc.so.6:mempcpy) redirected to 0x4a2a6e0 (_vgnU_ifunc_wrapper)
--19578-- REDIR: 0x547bc10 (libc.so.6:bcmp) redirected to 0x4a2a6e0 (_vgnU_ifunc_wrapper)
--19578-- REDIR: 0x547ad00 (libc.so.6:strncmp) redirected to 0x4a2a6e0 (_vgnU_ifunc_wrapper)
--19578-- REDIR: 0x547a800 (libc.so.6:strcmp) redirected to 0x4a2a6e0 (_vgnU_ifunc_wrapper)
--19578-- REDIR: 0x547bd40 (libc.so.6:memset) redirected to 0x4a2a6e0 (_vgnU_ifunc_wrapper)
--19578-- REDIR: 0x54990f0 (libc.so.6:wcschr) redirected to 0x4a2a6e0 (_vgnU_ifunc_wrapper)
--19578-- REDIR: 0x547aca0 (libc.so.6:strnlen) redirected to 0x4a2a6e0 (_vgnU_ifunc_wrapper)
--19578-- REDIR: 0x547a870 (libc.so.6:strcspn) redirected to 0x4a2a6e0 (_vgnU_ifunc_wrapper)
--19578-- REDIR: 0x547bfa0 (libc.so.6:strncasecmp) redirected to 0x4a2a6e0 (_vgnU_ifunc_wrapper)
--19578-- REDIR: 0x547a840 (libc.so.6:strcpy) redirected to 0x4a2a6e0 (_vgnU_ifunc_wrapper)
--19578-- REDIR: 0x547c0e0 (libc.so.6:memcpy@@GLIBC_2.14) redirected to 0x4a2a6e0 (_vgnU_ifunc_wrapper)
--19578-- REDIR: 0x547ada0 (libc.so.6:strpbrk) redirected to 0x4a2a6e0 (_vgnU_ifunc_wrapper)
--19578-- REDIR: 0x547a7c0 (libc.so.6:index) redirected to 0x4a2a6e0 (_vgnU_ifunc_wrapper)
--19578-- REDIR: 0x547ac70 (libc.so.6:strlen) redirected to 0x4a2a6e0 (_vgnU_ifunc_wrapper)
--19578-- REDIR: 0x54856c0 (libc.so.6:memrchr) redirected to 0x4a2a6e0 (_vgnU_ifunc_wrapper)
--19578-- REDIR: 0x547bff0 (libc.so.6:strcasecmp_l) redirected to 0x4a2a6e0 (_vgnU_ifunc_wrapper)
--19578-- REDIR: 0x547bbe0 (libc.so.6:memchr) redirected to 0x4a2a6e0 (_vgnU_ifunc_wrapper)
--19578-- REDIR: 0x5499eb0 (libc.so.6:wcslen) redirected to 0x4a2a6e0 (_vgnU_ifunc_wrapper)
--19578-- REDIR: 0x547b050 (libc.so.6:strspn) redirected to 0x4a2a6e0 (_vgnU_ifunc_wrapper)
--19578-- REDIR: 0x547bf20 (libc.so.6:stpncpy) redirected to 0x4a2a6e0 (_vgnU_ifunc_wrapper)
--19578-- REDIR: 0x547bef0 (libc.so.6:stpcpy) redirected to 0x4a2a6e0 (_vgnU_ifunc_wrapper)
--19578-- REDIR: 0x547d7f0 (libc.so.6:strchrnul) redirected to 0x4a2a6e0 (_vgnU_ifunc_wrapper)
--19578-- REDIR: 0x547c040 (libc.so.6:strncasecmp_l) redirected to 0x4a2a6e0 (_vgnU_ifunc_wrapper)
--19578-- REDIR: 0x548e330 (libc.so.6:__strrchr_sse2) redirected to 0x4c32790 (__strrchr_sse2)
--19578-- REDIR: 0x5474070 (libc.so.6:malloc) redirected to 0x4c2faa0 (malloc)
--19578-- REDIR: 0x548e620 (libc.so.6:__strlen_sse2) redirected to 0x4c32d30 (__strlen_sse2)
--19578-- REDIR: 0x556cfc0 (libc.so.6:__memcmp_sse4_1) redirected to 0x4c35d50 (__memcmp_sse4_1)
--19578-- REDIR: 0x5486e70 (libc.so.6:__strcmp_sse2_unaligned) redirected to 0x4c33da0 (strcmp)
Begin
--19578-- REDIR: 0x5498440 (libc.so.6:__mempcpy_sse2_unaligned) redirected to 0x4c37130 (mempcpy)
please input args: carPath, roadPath, crossPath, answerPath
--19578-- REDIR: 0x5498870 (libc.so.6:__memset_sse2_unaligned) redirected to 0x4c365d0 (memset)
--19578-- REDIR: 0x5474950 (libc.so.6:free) redirected to 0x4c30cd0 (free)
==19578==
==19578== HEAP SUMMARY:
==19578== in use at exit: 0 bytes in 0 blocks
==19578== total heap usage: 2 allocs, 2 frees, 73,728 bytes allocated
==19578==
==19578== All heap blocks were freed -- no leaks are possible
==19578==
==19578== ERROR SUMMARY: 0 errors from 0 contexts (suppressed: 0 from 0)
==19578== ERROR SUMMARY: 0 errors from 0 contexts (suppressed: 0 from 0)
How can I get the core dump file?
A core dump file is a memory copy of the program runtime, through which you can debug the program to find the place where the bug is found;
When there is a segmentation error in the program, the Linux kernel will write a core dump file to the hard disk according to the configuration.
Linux uses ulimit to set the maximum number of connections. ulimit can only be modified temporarily. After restarting, it fails:
Ulimit -c sets the maximum value of the core file, the unit is the block;
Ulimit -a displays the current resource limit settings.
Use ulimit -c unlimited to set the core file to infinity.
The reason why the core file cannot be generated:
There is not enough memory space;
The creation of the core file is disabled;
Set the current directory of a process without the permission to write files;
Use the command sudo sysctl -w kernel.core_pattern=/tmp/core-%e.%p.%h.%t to set the kernel to generate the form and location of the core file, put it in the /tmp directory and display the timestamp.
When the program has a segmentation error, the Linux kernel will automatically save a core file in the /tmp directory.
The size limit of the core file in a process can also be displayed by using cat /proc/PID/limit.
Kernel.core_pattern indicates where the coredumps file is placed. It is a kernel parameter that can be viewed and controlled by sysctl:
Sysctl -a means to view all the parameters of the kernel, or use sysctl kernel.core_pattern to display the parameters of kernel.core_pattern.
Backtracking of generated core files with GDB tools
Open a file called my_core_file with the command gdb -c my_core_file.
The result of debugging my coredump program is as follows:
sudo gdb -c /tmp/core-CodeCraft-2019.23637.jl.1554030516
GNU gdb (Ubuntu 8.1-0ubuntu3) 8.1.0.20180409-git
Copyright (C) 2018 Free Software Foundation, Inc.
License GPLv3+: GNU GPL version 3 or later http://gnu.org/licenses/gpl.html
This is free software: you are free to change and redistribute it.
There is NO WARRANTY, to the extent permitted by law. Type "show copying"
and "show warranty" for details.
This GDB was configured as "x86_64-linux-gnu".
Type "show configuration" for configuration details.
For bug reporting instructions, please see:
http://www.gnu.org/software/gdb/bugs/.
Find the GDB manual and other documentation resources online at:
http://www.gnu.org/software/gdb/documentation/.
For help, type "help".
Type "apropos word" to search for commands related to "word".
[New LWP 23637]
Core was generated by `./bin/CodeCraft-2019 ../1-map-training-1/car.txt ../1-map-training-1/road.txt .'.
Program terminated with signal SIGSEGV, Segmentation fault.
0 0x0000556393da88ad in ?? ()
(gdb)
It can be seen that the program received a SIGSEGV signal during execution, which indicates that a process has executed an invalid memory reference or a segmentation error has occurred.
Then in the gdb tool non-stop bt find the number of lines in the program and the reason for the segmentation error.
The meaning of bt is backtrace, which lists the call stack.
Several command parameters commonly used in gdb debugging:
Attach uses GDB to debug a running process gdb PID;
Br is used to set breakpoints, br filename:line_num,br namespace::classname::func_name;
n: single step skip, s: single step;
Finish: execution to the return of the function return;
List: lists 10 lines of code after the current position; list line_number lists the ten lines of code after line_number;
Info locals lists the local variables of the current function;
p var_ print variable value;
Info breakpoints lists all breakpoints;
Delete breakpoints delete all breakpoints;
Delete breakpoints id deletes the breakpoint numbered id;
Disable/enable breakpoints id disable/start breakpoints;
Break ... if ... conditional interruption;
My program has a lot of question marks after executing bt. This is because gdb does not load the information of my library. When compiling, you need to add the -g option:
(gdb) bt
0 0x0000556393da88ad in ?? ()
1 0x00000009b6f194c0 in ?? ()
2 0x00005563b686d1b0 in ?? ()
3 0x00005563b688abe0 in ?? ()
4 0x00007ffe22b8c070 in ?? ()
5 0x00005563b5f36460 in ?? ()
6 0x0000000000002bf9 in ?? ()
7 0x0000000000000004 in ?? ()
8 0x00005563b718a580 in ?? ()
9 0x0000000000000020 in ?? ()
10 0x00007ffe22b8c510 in ?? ()
11 0x00007ffe22b8bf50 in ?? ()
12 0x00005563b6a2ffd0 in ?? ()
13 0x00007ffe22b8bf50 in ?? ()
14 0x0000000000000008 in ?? ()
15 0x00005563b6a30004 in ?? ()
16 0x00007ffe22b8c450 in ?? ()
17 0x00007ffe22b8c590 in ?? ()
18 0x0000556393dabd1e in ?? ()
19 0x00007f1b3f2da1f0 in ?? ()
20 0x0000556393dabcd2 in ?? ()
21 0x00007ffe22b8c610 in ?? ()
22 0x00007ffe22b8bf00 in ?? ()
23 0x00007ffe22b8c550 in ?? ()
24 0x00007ffe22f747d0 in ?? ()
25 0x00007ffe22b8c220 in ?? ()
26 0x00007ffe22b8c200 in ?? ()
27 0x0000000000000032 in ?? ()
28 0x00007ffe22b8c470 in ?? ()
29 0x00007ffe22b8c530 in ?? ()
30 0x00007ffe22b8c070 in ?? ()
31 0x00007ffe22b8c4f0 in ?? ()
32 0x00007ffe22b8c510 in ?? ()
33 0x00000000000211e0 in ?? ()
34 0x00007ffe22b8c5b0 in ?? ()
35 0x0000000022b8c490 in ?? ()
36 0x0000000000000198 in ?? ()
37 0x00007ffe22b8c490 in ?? ()
38 0x00007ffe22b8c630 in ?? ()
39 0x00007ffe22b8befc in ?? ()
40 0x00003d2400000005 in ?? ()
41 0x0000000000000000 in ?? ()
Execute the symbol-file shared dynamic library path in gdb to load the dynamic library search path when gdb debugging.
The ldd command can list the dependencies of a binary file.
Use set solib-search-path to find dependent libraries.
0 0x0000556393da88ad in ?? ()
1 0x00000009b6f194c0 in ?? ()
2 0x00005563b686d1b0 in ?? ()
3 0x00005563b688abe0 in ?? ()
4 0x00007ffe22b8c070 in ?? ()
5 0x00005563b5f36460 in ?? ()
6 0x0000000000002bf9 in ?? ()
7 0x0000000000000004 in void std::__cxx11::basic_string, std::allocator >::_M_construct>(char, char*, std::forward_iterator_tag) [clone .isra.44]()
8 0x00007ffe22b8c510 in ?? ()
9 0x00007ffe22b8bf50 in ?? ()
10 0x00005563b6a2ffd0 in ?? ()
11 0x00007ffe22b8bf50 in ?? ()
12 0x0000000000000008 in void std::__cxx11::basic_string, std::allocator >::_M_construct>(char, char*, std::forward_iterator_tag) [clone .isra.44]()
13 0x0000556393dabd1e in ?? ()
14 0x00007f1b3f2da1f0 in ?? ()
15 0x0000556393dabcd2 in ?? ()
16 0x00007ffe22b8c610 in ?? ()
17 0x00007ffe22b8bf00 in ?? ()
18 0x00007ffe22b8c550 in ?? ()
19 0x00007ffe22f747d0 in ?? ()
20 0x00007ffe22b8c220 in ?? ()
21 0x00007ffe22b8c200 in ?? ()
22 0x0000000000000032 in void std::__cxx11::basic_string, std::allocator >::_M_construct>(char, char*, std::forward_iterator_tag) [clone .isra.44]()
23 0x00000000000211e0 in ?? ()
24 0x00007ffe22b8c5b0 in ?? ()
25 0x0000000022b8c490 in ?? ()
Backtrace stopped: Cannot access memory at address 0x195
The final result of gdb debugging is:
[New LWP 5070]
Core was generated by `8, 6238, 6768, 6414, 5857, 6219, 6774, 5642, 5099, 6080)
(gdb) frame 0
0 0x00007fa69aa8f17c in ___vsnprintf_chk (s=0x7ffcb1275ffa ", 5347", maxlen=,
flags=1, slen=<optimized out>, format=0x55e0aef3a657 ", %d", args=args@entry=0x7ffcb0e28c00) at vsnprintf_chk.c:6666 in vsnprintf_chk.c
(gdb) frame 1
1 0x00007fa69aa8f095 in ___snprintf_chk (s=, maxlen=, flags=, slen=,
format=<optimized out>) at snprintf_chk.c:3434 snprintf_chk.c: No such file or directory.
(gdb) frame 2
2 0x000055e0aef2ee70 in writeResult(std::vector >, std::allocator > > > const&, std::vector >, std::allocator > > >&, std::unordered_map, std::equal_to, std::allocator > >&, char*, int) ()
(gdb) frame 3
3 0x000055e0aef35e5f in scheduling(std::vector >&, std::vector >&, std::vector >&, std::__cxx11::basic_string, std::allocator >) ()
(gdb) frame 4
4 0x35202c3536303620 in ?? ()
The above results indicate that a segmentation error occurred in the writeResult function.
Use thread apply all bt full to see how each thread is used on the stack.
The most important instructions in the GDB process are:
- gdb core-CodeCraft-2019.5070.jl.1554081713
- set solib-absolute-prefix /
- set solib-search-path /
- File executable
- core-file core-CodeCraft-2019.5070.jl.1554081713
- frame 2
Original address
Intelligent Recommendation
Fortran programs under Linux News 'Segmentation fault (core dumped)' error
Today, a program run under Linux, always encountered Segmentation fault error. The same program in their PC Windows10 operating normally, see the Linux machine, enough memory. using Intel compiler ifo...
Linux runs spyder error: segmentation fault (core dumped)
After you install linux anaconda, run the following error is displayed spyder One blogger solve this problem, the link below Solution: An input terminal After the installation is complete spyder run t...
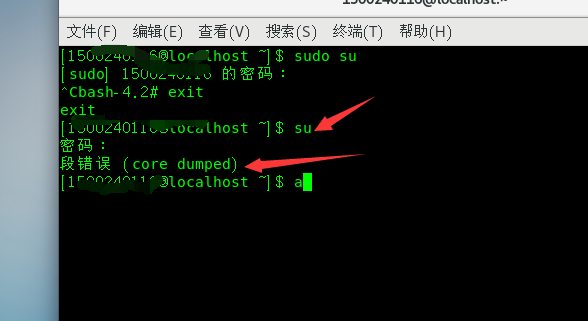
Linux reports a segmentation error when entering administrator mode (core dumped)
1. Background: Linux environment, enter su and enter password and break out of a segfault (core dumped) Reason: The file ~/.bashrc has been modified Solution: sudo su After pressing the car, directly ...
Debug python - Segmentation fault (core dumped)
Phenomenon: PyTorch code can be trained before, and suddenly appear to see the error of Segmentation Fault (Core Dumped), I can’t run anything. debug: When running, add solve: You can find the c...

Linux encounters Aborted (core dumped)
1. Problem description 2. Analysis of Core Dump 2.1 What is Core Dump Core meansRAM, Dump meansThrow it out. When developing (or using) a program, sometimes the program goes down inexplicably, but the...
More Recommendation

Keras-Segment fault (core dumped) solution
I recently ran CNN on the server and there was a problem. When the picture is small (6*128), the GPU can run normally, when the picture is slightly larger (36*128), it will appear.Segment fault (core ...
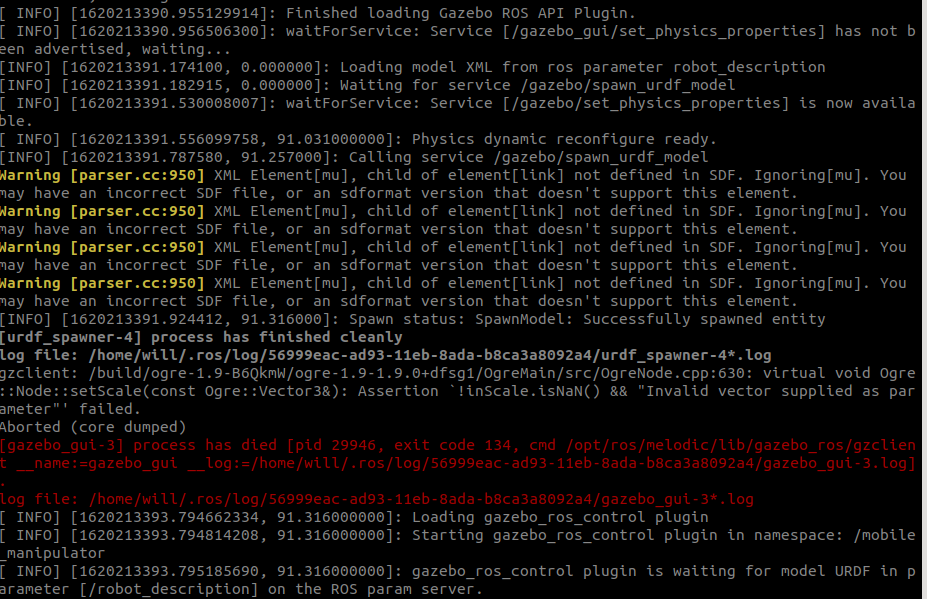
Gazebo core error, flashback Aborted (Core Dumped)
After combining the URDF of ARM and BASE, I am ready to import Model, starting gazebo to make simulation, I didn't expect to flash back, but RVIZ can start, get a few hours, there is no corresponding ...
linux run spyder error: segmentation fault (core dumped) and ERROR conda.core.link:_execute(502)
linux run spyder error: segmentation fault (core dumped) and error ERROR conda.core.link:_execute(502) Bit error correction of the record. After running spyder linux installation anaconda, enter at an...
Linux Apt-Get Update error: Error In `AppStreamCli ': double free or corruption ... Aborted (Core Dumped)
reason: Ubuntu16.0.4 Built-in libappstream is 2.0 previous version, we must update to version of 3.0 or more Solution: Clearlibappstream3(Purge is more cleaning up profile than remove) operation resul...
[Linux Clen Chicken Center] Linux Drive Module Uninstall, RMMOD error "segmentation fault (core dumped)"
[Linux Clen Chicken Center] Drive Module Uninstall, RMMOD error "segmentation fault (core dumped)" [Pillax] Open this column main records, all kinds of rookic chicken encountered during Linu...