If you use slickedit + mingw to compile code and debug on win10
tags: tool slickedit mingw Compile
surroundings:
OS:win10
slickedit:V23
mingw:mingw—x86-64-7.3.1
The main introduction here is how to use slickedit and mingw to compile the code, so the steps to install slickedit and mingw are omitted. I installed qt5.12.6 with mingw. After installing mingw, you need to add the path to the system.
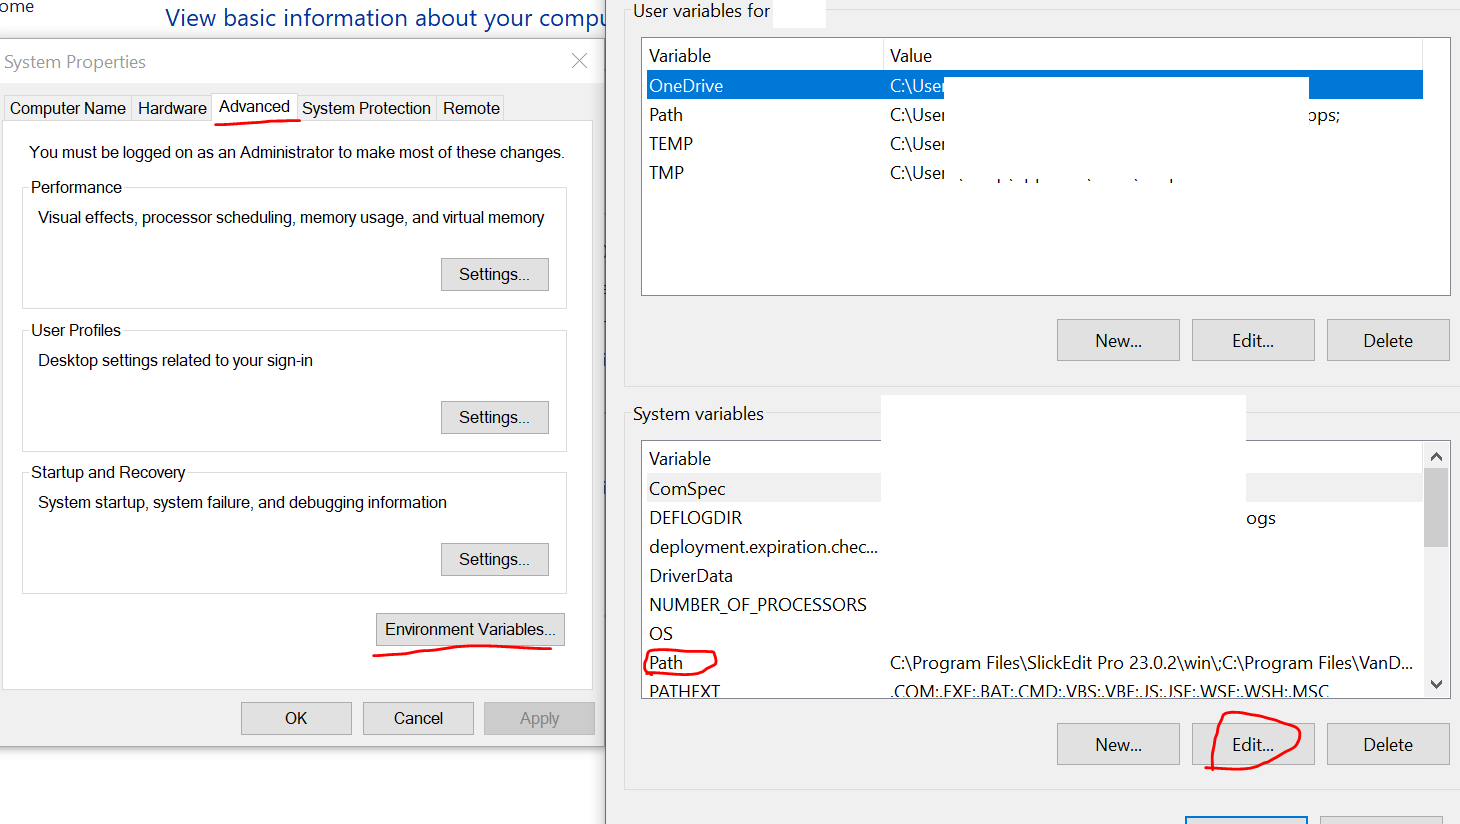
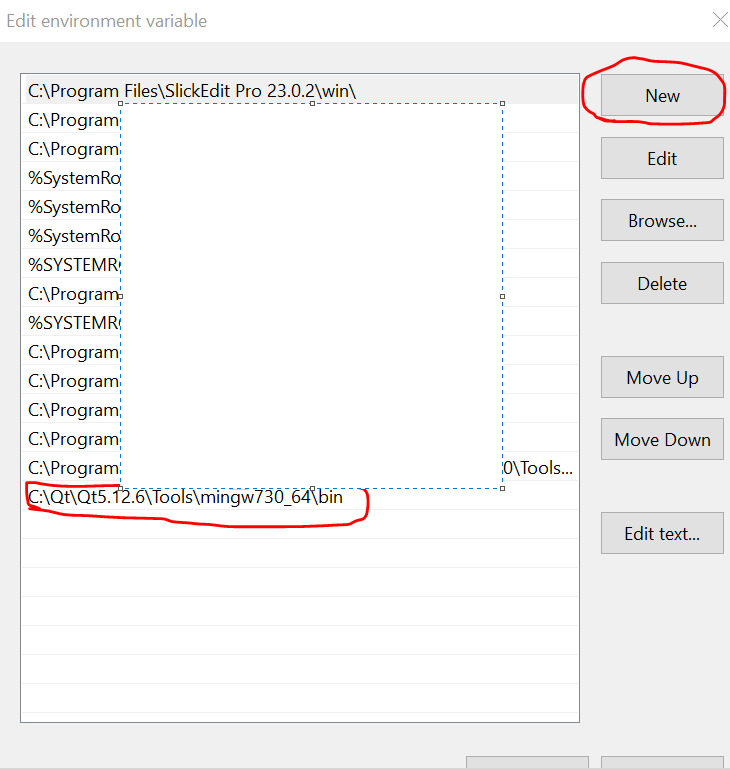
Step 1: Right-click This PC--->Proterties--->Advanced system settings--->Advanced--->Environment Variables...--->System variables--->Path---> on the desktop Edit--->New--->Add the path of mingw, my path is C:\Qt\Qt5.12.6\Tools\mingw730_64\bin
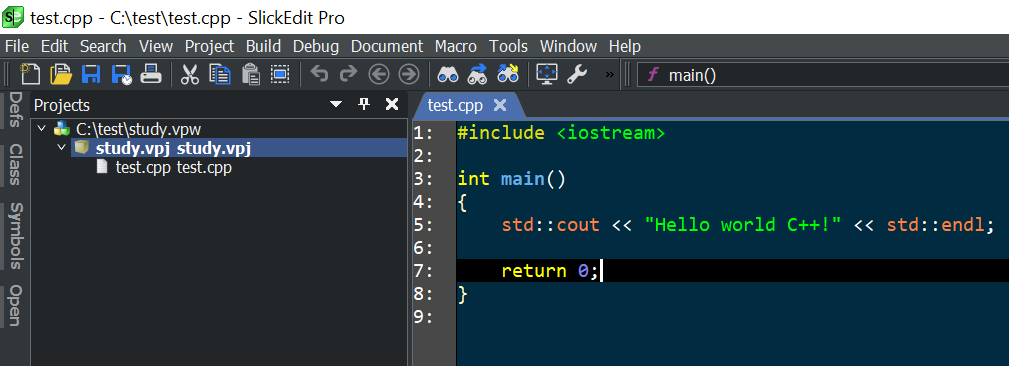
After setting the environment variables, we use slickedit to build a project. I have created a study project here (note whether a makefile needs to be selected according to your actual needs when creating the project, I am just a simple demonstration here, no make is selected). As shown below:
Step 2: Build--->GNU C Options...
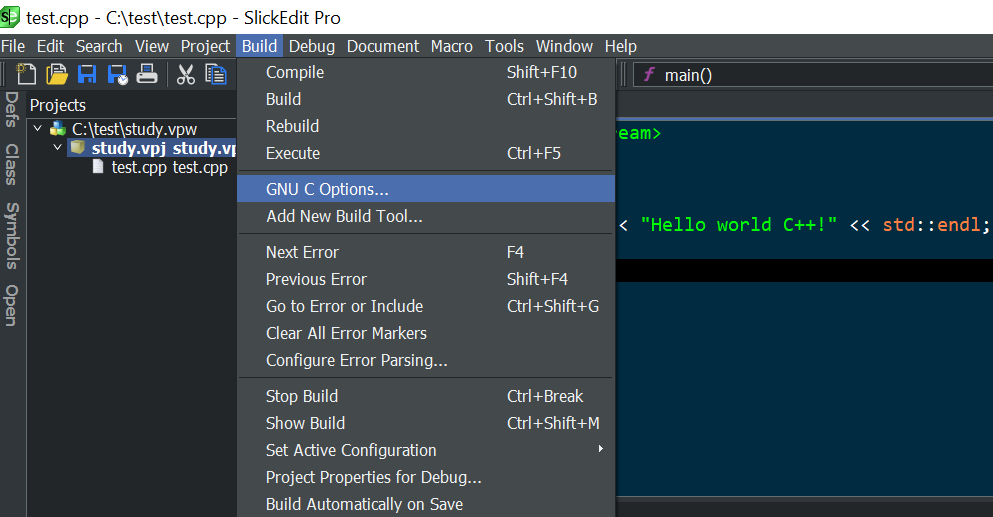
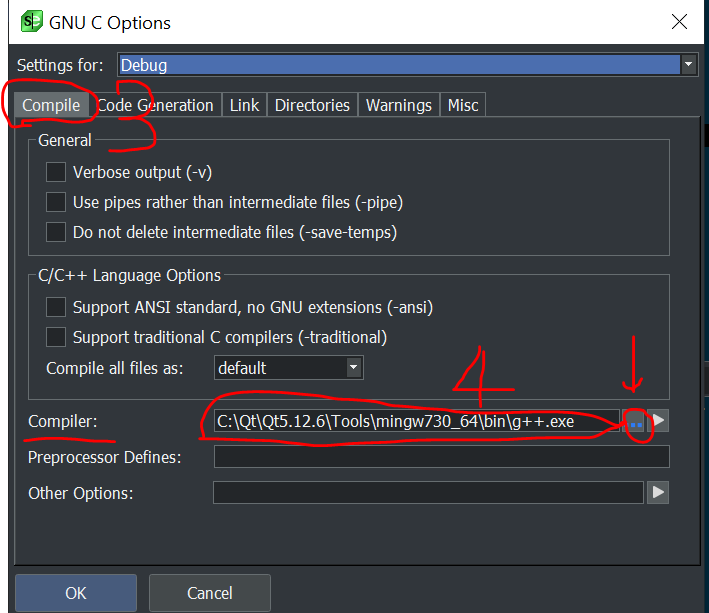
Step 3: Select Compile in the pop-up GNU C Options dialog box, and then select Compiple belowr: Select the path where g++ of mingw is located.
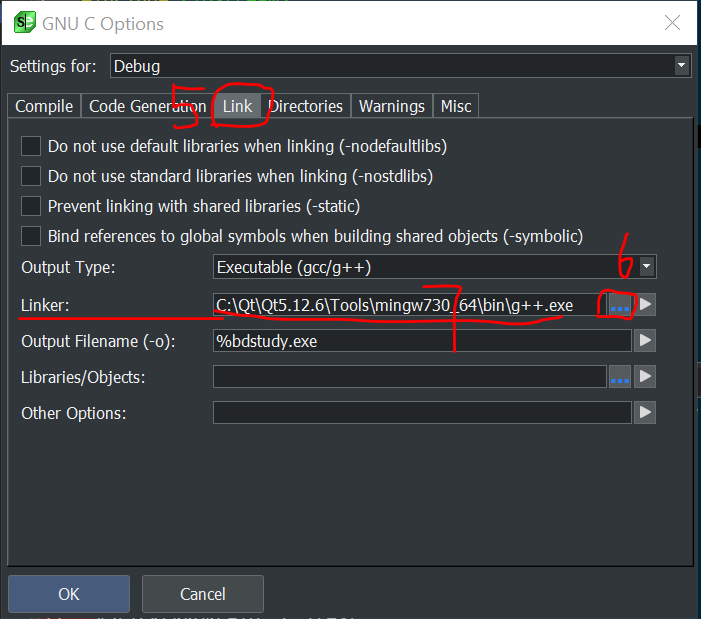
Step 4: Select Link in the GNU C Options dialog box, and then select the path where mingw's g++ is located in the following Linker.
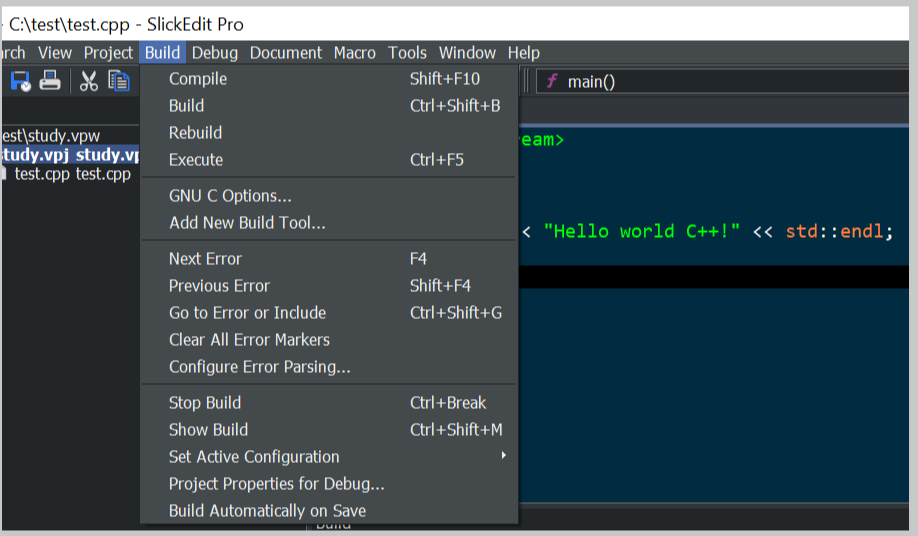
Step 5: Select Compile--->Build--->Execute, etc. in Build.
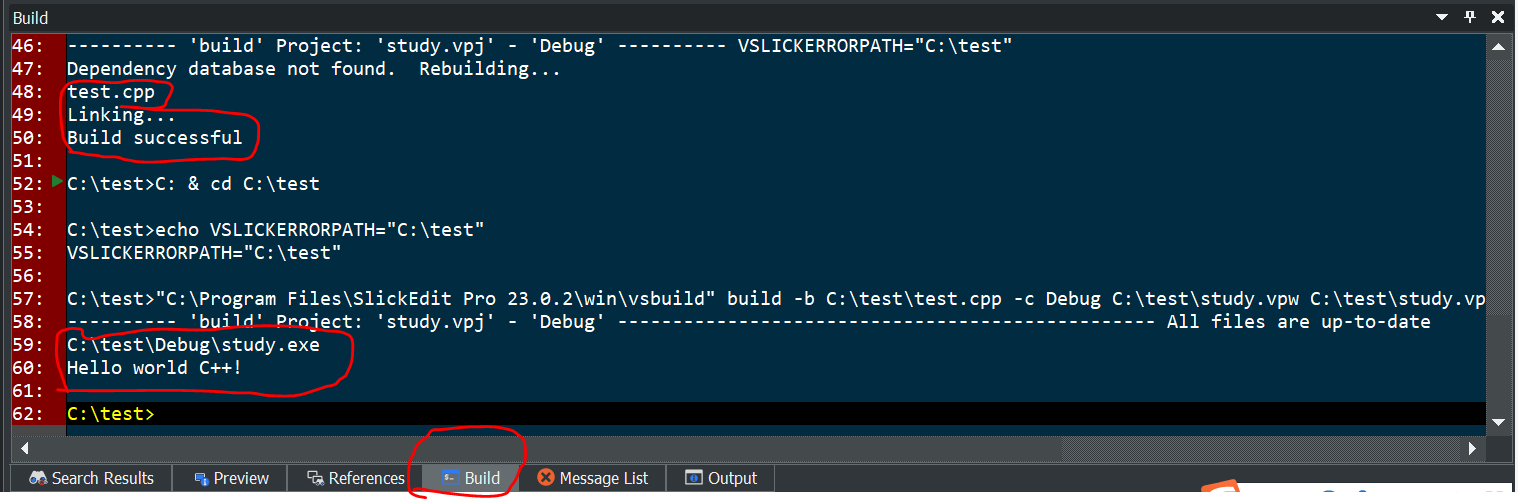
The operation result is shown in the following figure:
Next, a brief introduction to the settings when debugging code.
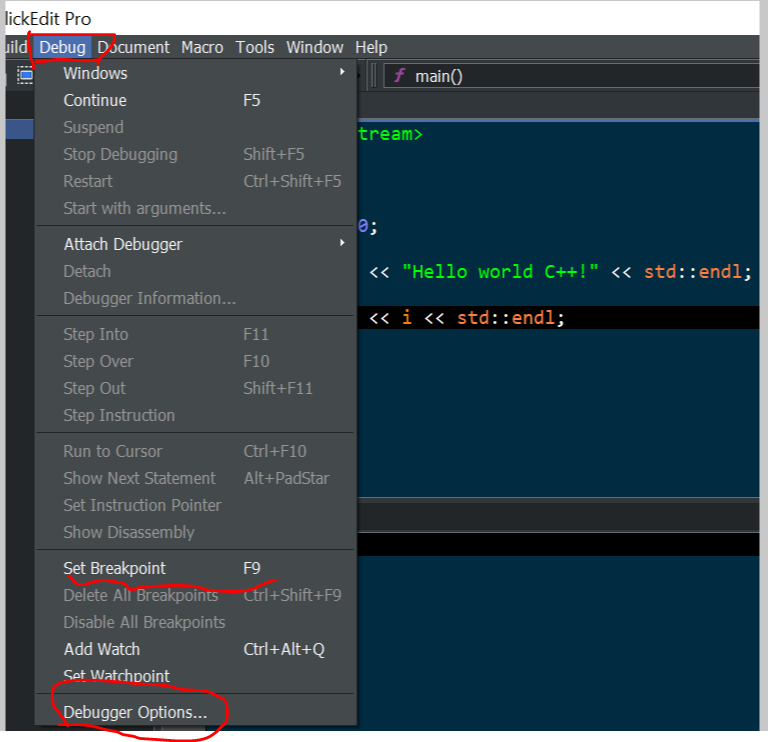
Step 1: Select Debugger Options... in the Debug drop-down menu. Note that I have already indicated that the shortcut key for setting a breakpoint with the red line is F9. As shown below:
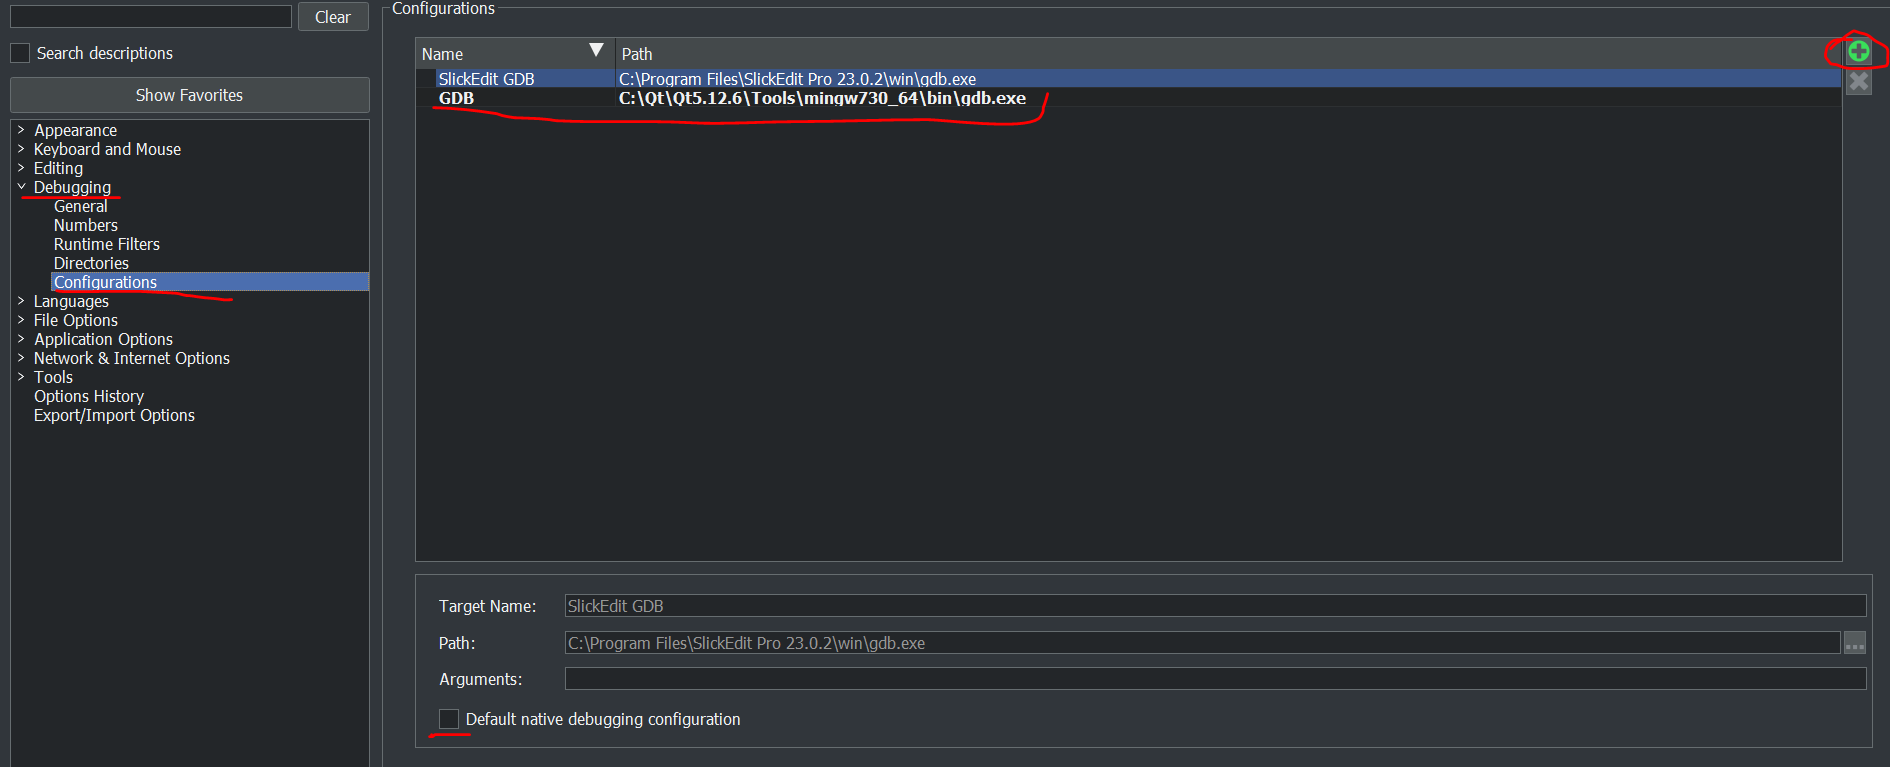
Step 2: Select Debugging--->Configurations in the pop-up window, and then click the plus sign in the upper right corner to select mingw's gdb. As shown below:
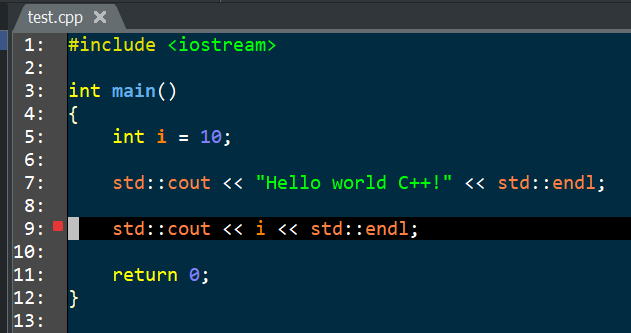
Step 3: Set the code breakpoint, click the line where the code needs to be set, and press F9. (The red dot in the box on line 9 is the breakpoint)
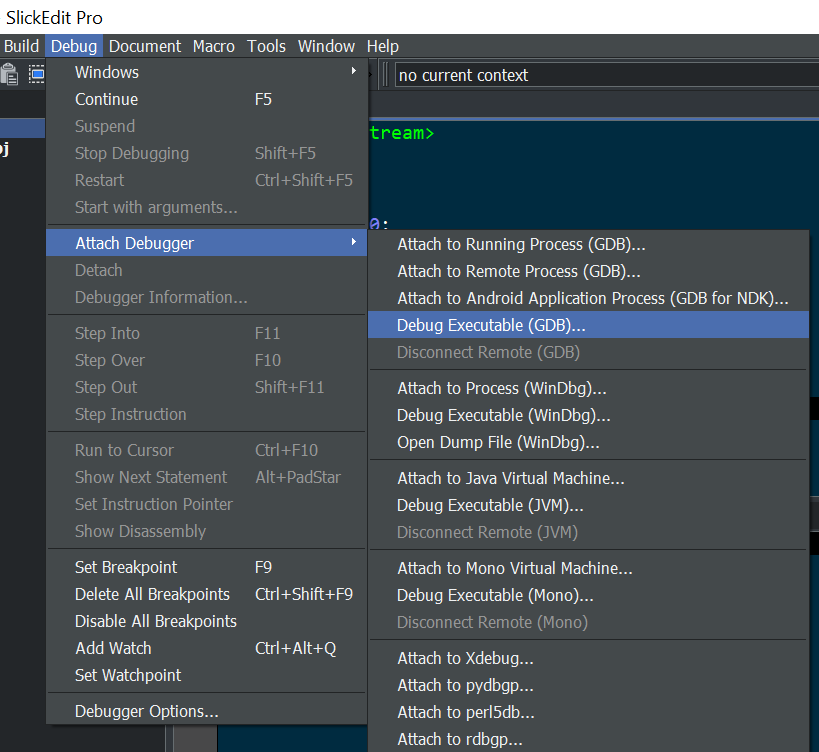
Step 4: Select Attach Debugger in Debug, and then select Debug Executable (GDB), as shown in the following figure:
Note: There are a variety of debugging methods in Attach Debugger, including remote debugging, debugging already running programs, etc., you can also use coredump files, etc.
Step 5: Select the generated execution file and source code file directory in the pop-up window, as shown in the following figure:
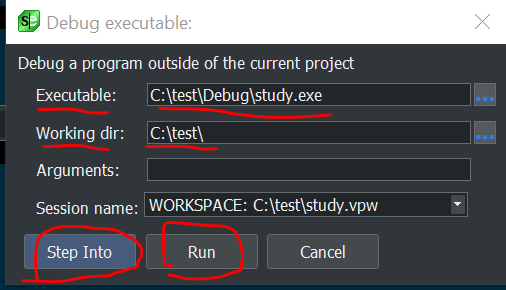
Step 6: I clicked Run directly here, and the program started to execute and stayed at line 9 of the code, as follows:
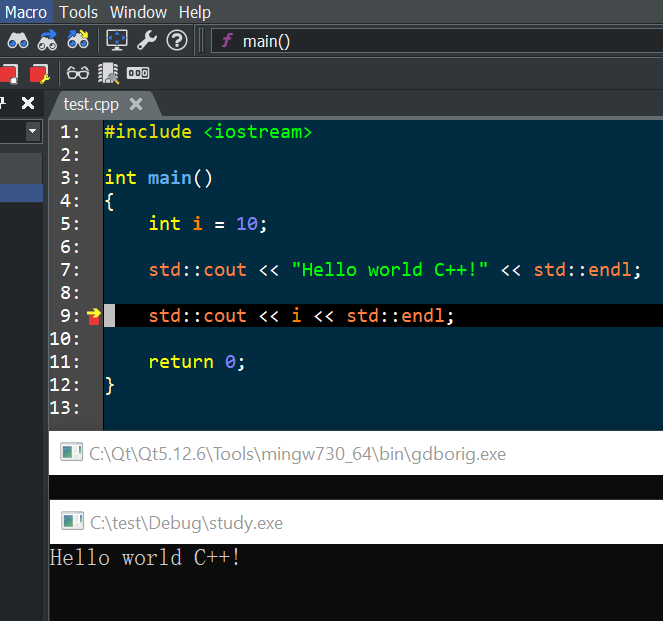
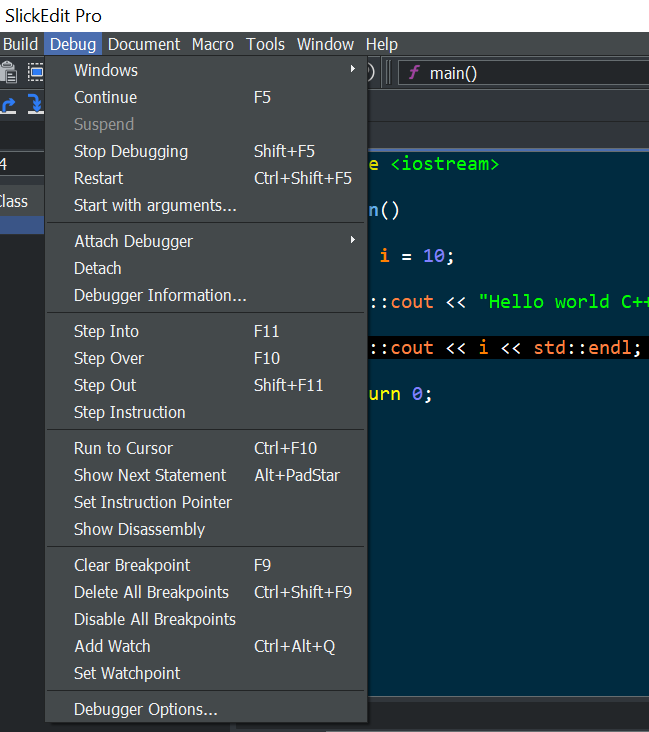
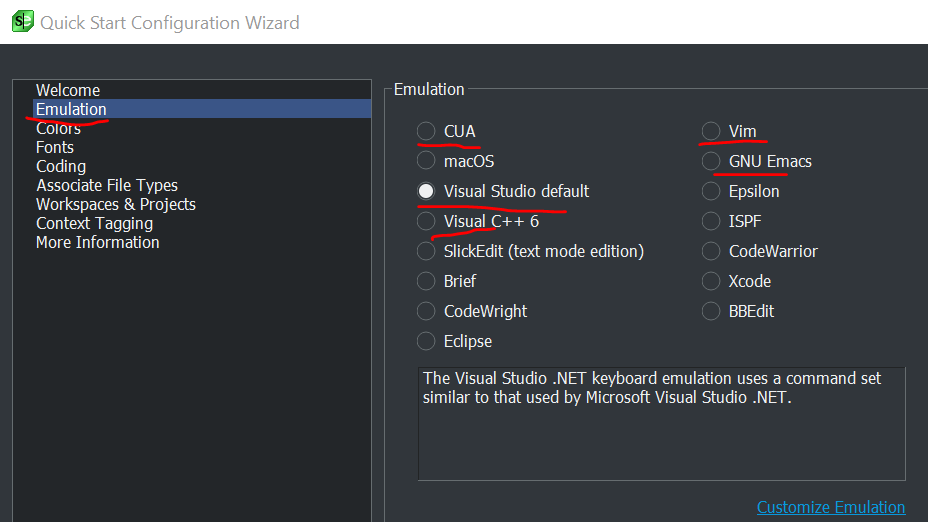
At this time, look at the Debug pull-down menu, F5, F11, F10, and other debugging shortcut keys can be used. For example, pressing F10 will continue to print 10. Note: I used Visual Studio default for slickedit simulation.
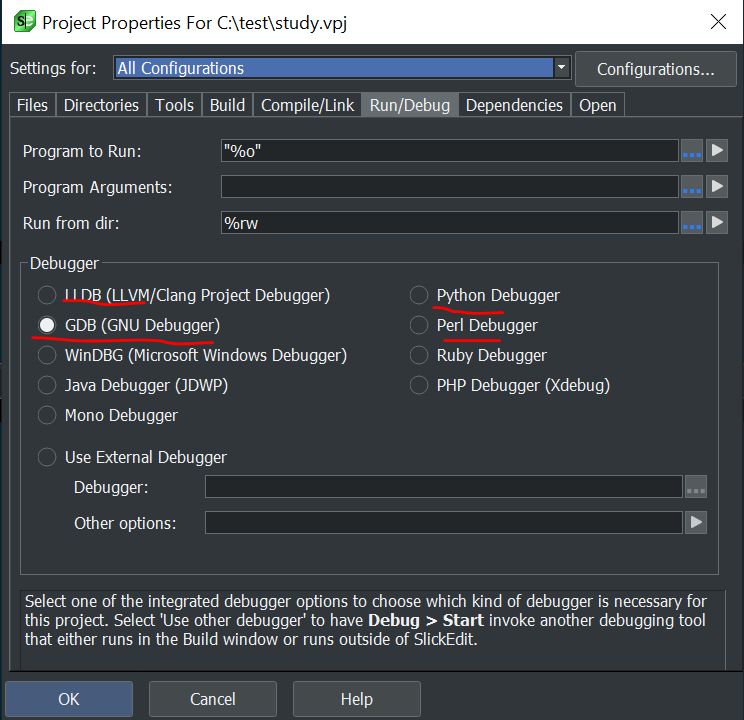
If you are using other programming languages such as python, you may need additional settings in the established project, specifically I did not try. Right-click on the created project and select Project Properties... from the pop-up menu as shown below:
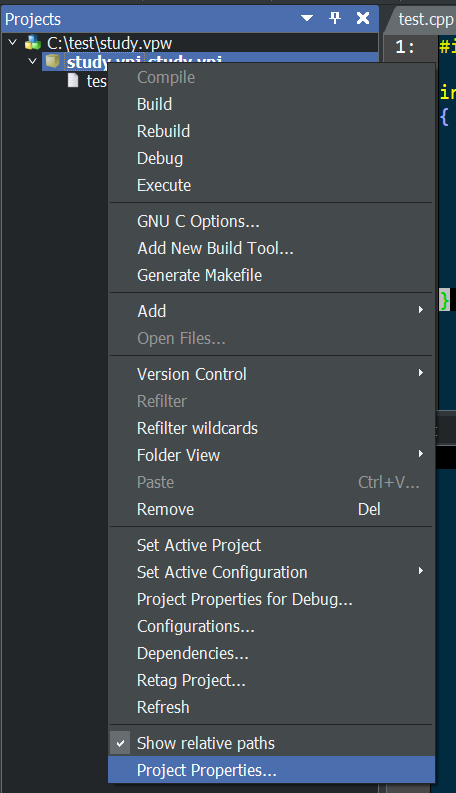
In the dialog box that pops up, GDB (GNU Debugger) is used by default. For languages such as Python, additional settings may be required here. Here is just a reminder.
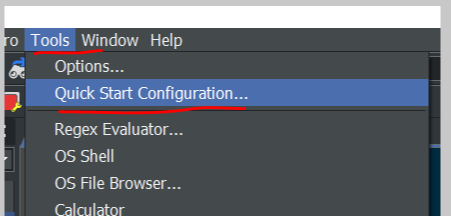
Note: The slickedit I use is emulated by Visual Studio default. This will be selected when installing slickedit. You can also select yourself through Tools--->Quick Start Configuration...--->Emulation---> Like and get used to simulation.
Intelligent Recommendation

Use VS Code to compile and debug C++ programs
Software and plug-in installation 1. Install vs code first; 2. Install the necessary plug-ins; search directly in the vs code extension and click install. 3. Install the C/C++ compilation tool and CMa...

slickEdit primary use
SlickEdit Version <?xml:namespace prefix = st1 ns = "urn:schemas-microsoft-com:office:smarttags" />13.0.2.0 Primary use Using pureCWhen programming,UEIt can already ...
Use slickedit instead of sourceinsight
Basic use of slickedit Article Directory Basic use of slickedit Introduction Build the project Basic operation Jump to the place of definition and call Preview function variables, etc. View all functi...
Teach you to compile Debug
The first article on assembly: Love love, this register is a bit interesting Hello everyone, I am a programmer CXUAN! Our article learned about the basic register, and we will take the actual operatio...
Compile and debug C programs using VSCode combined with mingw on Windows
Use VSCode combined with mingw to compile and debug C programs on Windows The goal is to use VSCode to debug C programs with mingw on Win7. To set the terminal as bash.exe. Windows7 has installed VSCo...
More Recommendation
Teach you to compile and debug Elasticsearch 6.3.2 source code
Foreword Want to understand Elasticsearch in depth, it is necessary to read its source code, you can understand its internal implementation, help to tune, and second, you can understand the code struc...
[Failed] Windows source code to compile SDL (MINGW)
The system Win7 32 bit for various reasons want to compile mingw version of SDL library out, so toss a bit. Installation according MINGW https://blog.csdn.net/qq_36113711/article/details/72778496. Dow...
Compile the project with Vs Code under Windows and MinGW
1. First, you need to configure MinGW environment variables, as shown in the figure below Configure the location of MinGW. This bin directory contains mingw compilation tools such as gcc/g++ 2....

Use MinGW to compile ffmpeg-2.8 and supports libfaac
1.1, MinGW line installation1, the compiler is installed on a Windows environment inhttp://www.mingw.org/Download the installation file. After downloading get mingw-get-setup.exe installation file, it...
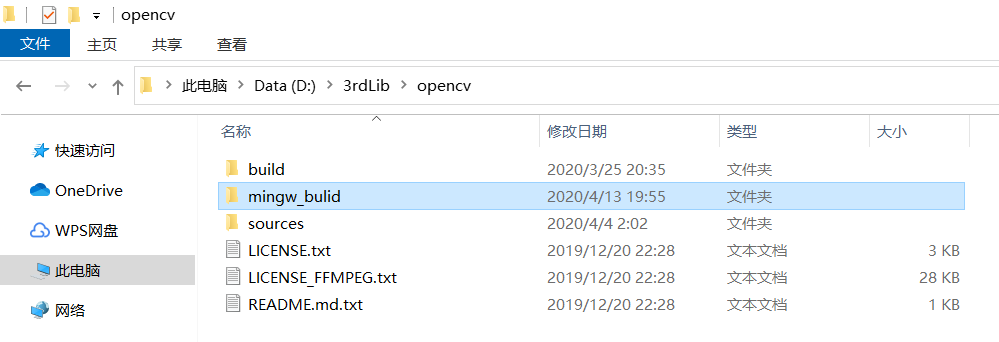
Use mingw to compile opencv library under Qt5.12.1
Development environment Windows 10 64 bit Qt 5.12.1 opencv-4.2.0 cmake-3.17.0-win64-x64 Ready to work Add environment variable "Path" Restart the computer Compilation process Open the decomp...