Detailed explanation of the meshgrid function of matlab
tags: meshgrid
Function form
[C,R] =meshgrid(c, r)
Preliminary explanation
The first thing to be clear is that the parameters c and r are both row vectors. This function transforms the domain specified by the row vectors c and r into arrays C and R. These 2 arrays can be used to indicate a function with 2 variables and a three-dimensional graph .
Each row of the output array C is a row vector c, and each column of the output array R is a row vector r. For example, we need to form a two-dimensional function whose elements are the sum of the squares of the coordinate variables x and y. That is, the form f(x,y) = x^2 +y^2. The variables x = 0,1,2 and y = 0,1. Trivially list all coordinate pairs:
(x,y) = (0,0) (0,1)
(1,0) (1,1)
(2,0) (2,1)
In matlab, what we need is such data, and then substitute the coordinate pair into the function to get the result.
[C,R] = meshgrid([0,1],[0,1,2])
%%%%%%%%%result%%%%%%%%%
C =

     0     1
     0     1
     0     1


R =

     0     0
     1     1
     2     2
%%%%%%%%%%%%


% f(1,1)  =  R(1,1).^2 +C(1,1).^2
f = R.^2 + C.^2
If you carefully observe the above results, you will find that the two-dimensional array of R specifies the row label (component) of x, and the two-dimensional array of C specifies the column label (component) of y.
Deepen understanding
Give another example, mainly to deepen the understanding of the meshgrid function, such as implementing f(x,y) = A*sin(u0*x+v0*y), where x = 0,1,2,...,M-1; y=0,1,2,….,N-1.
In addition, it should be noted that the constants of M, N, A, u0, v0 are all given by themselves.
First give a general implementation, but the rate is very slow.
for r =1:M
    u0x = u0*(r-1)
    for c=1:N
        v0y =v0*(c-1)
        f(r,c) = A*sin(u0x+v0y)
    end
end
Use the meshgrid function to achieve, according to the conditions given above, explain that x = [0,1,..,M-1] and y=[0,1,...,N-1], so we will determine c and r these two row vectors. Then generate the corresponding two-dimensional arrays C and R of row and column labels.
r = 1:M-1;
c = 1: N-1;
[C,R] =meshgrid(c,r);

g = A*sin(u0*R +v0*C);

g = mat2gray(g);
imshow(g)Intelligent Recommendation
[MATLAB] Meshgrid
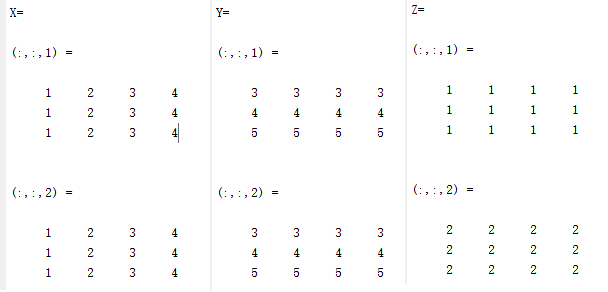
Function parameter list [X,Y] = meshgrid(x,y) [X,Y] = meshgrid(x) [X,Y,Z] = meshgrid(x,y,z) [X,Y,Z] = meshgrid(x) meshgrid2D or 3D matrix can be generated, If it is 2D, the Shape of the matrix is (Y...
Meshgrid in matlab
The generated Y is From the bottom up, it is gradually decreasing, which doesn't matter. Who lets the form written down from top, we y = [- 1: 0.5: 1] '; it is generated from a small generation to the...
Detailed explanation of Matlab xcorr function
Matlab provides a function xcorr function for calculating cross-correlation and autocorrelation 1. How to use c = xcorr(x,y) c = xcorr(x) c = xcorr(x,y,‘option’) c = xcorr(x,‘option&...
Detailed explanation of the stretchlim function in Matlab
The imadjust function is a toolbox function of MATLAB. The general syntax call format is: f1=imadjust(f,[low_in high_in],[low_out high_out],gamma) (Note: The image data described in this a...

Detailed explanation of diff function (matlab)
Original address: http://blog.csdn.net/u013018721/article/details/37766187 The diff function is used to find derivatives and differences. Whether it is derivative or difference, the principle is the s...
More Recommendation
Detailed explanation of the unique function in matlab
C = unique(A): The value returned is the same as in A, but there are no duplicate elements. The resulting vector is sorted in ascending order. Example: 1. Filter out duplicate values in the vector, ...
Meshgrid function
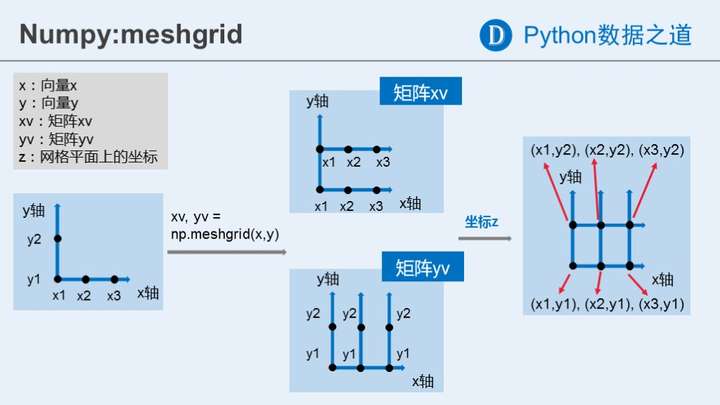
The meshgrid function draws a grid on a plane with points on two coordinate axes. usage: [X,Y]=meshgrid(x,y) [X,Y]=meshgrid(x) is equivalent to [X,Y]=meshgrid(x,x) [X,Y,Z]=meshgrid(x,y,z) genera...
meshgrid() function
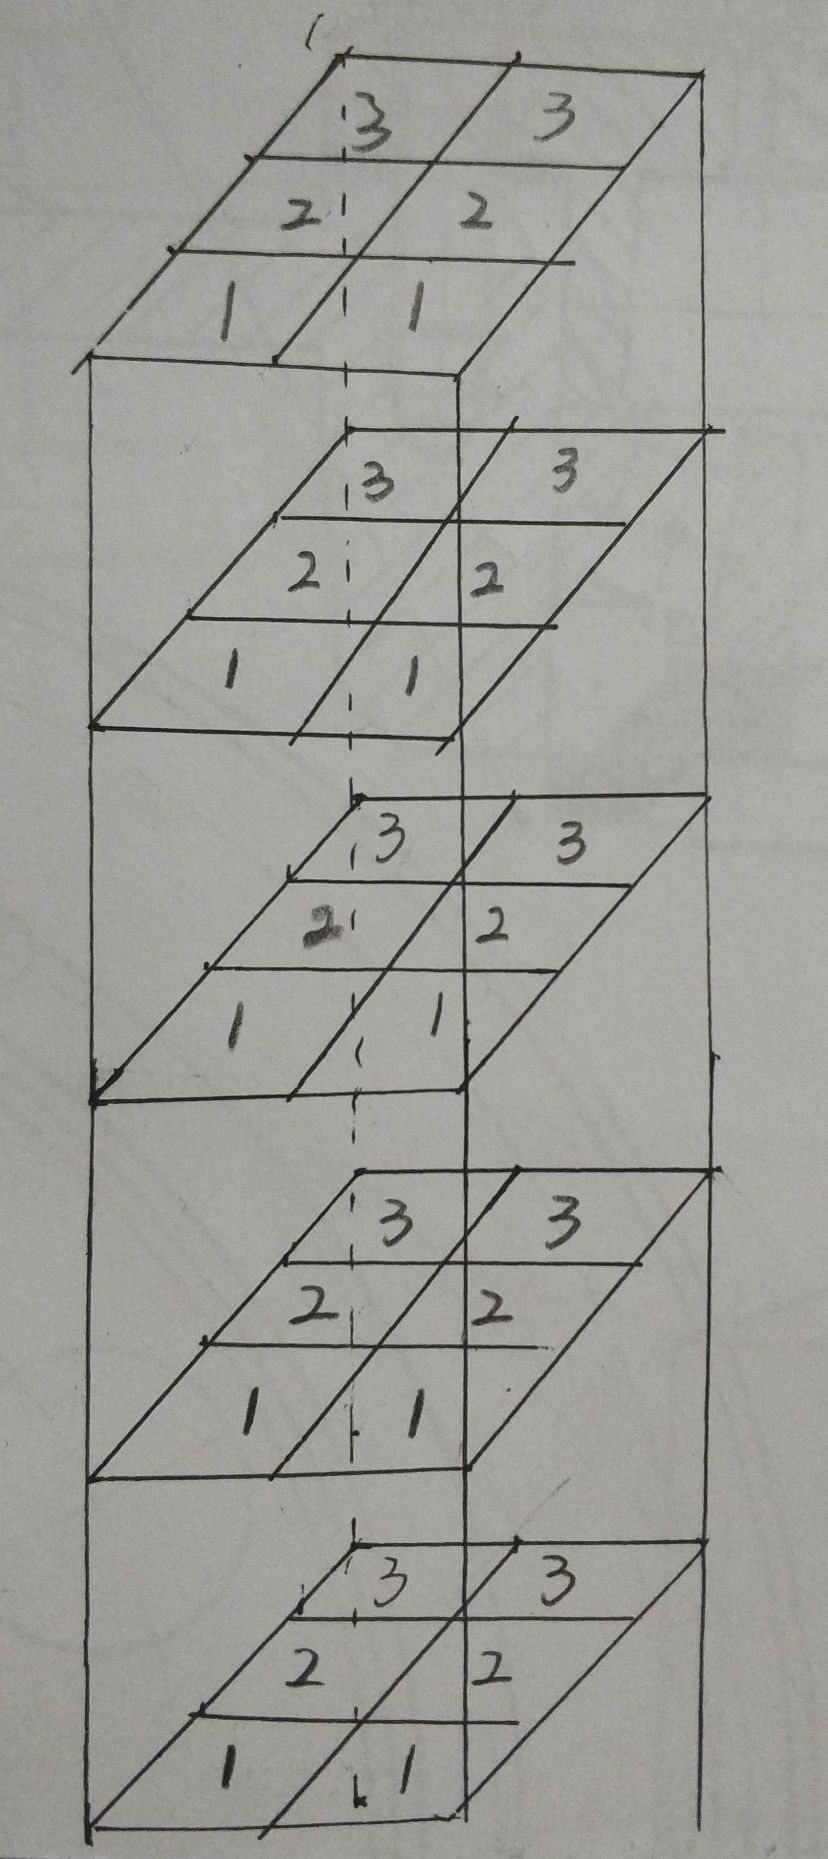
Function function Suppose there are two vectors x=[1:3], y=[1:2], through the meshgrid() function we can get Assuming there are three vectors x=[1:3], y=[4:5], z=[6:10], we can get through the meshgri...

MATLAB-3D diagram - Meshgrid - case analysis and explanation - contain specific code
table of Contents 1, Matlab painting 3D map Meshgrid function profile 2, for loop painting 3D diagram 1, Matlab painting 3D map Meshgrid function profile Meshgrid function in matlab is used to generat...