Python3 uses Matplotlib to draw wind speed wind -oriented rose map
tags: Python3 python matlab Wind rose map
Background
Wind roses are graphics tools used by meteorologists to give a concise view tool that is usually distributed in a specific location in a specific location.
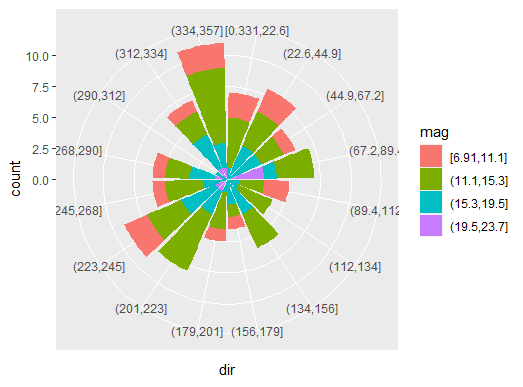
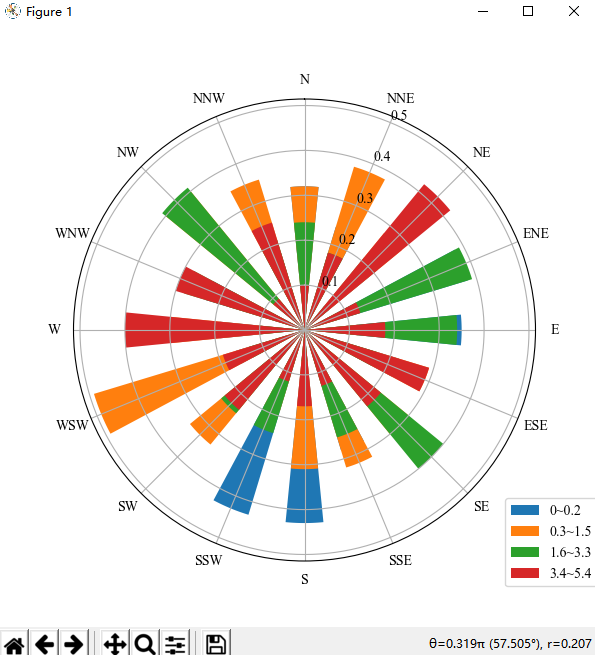
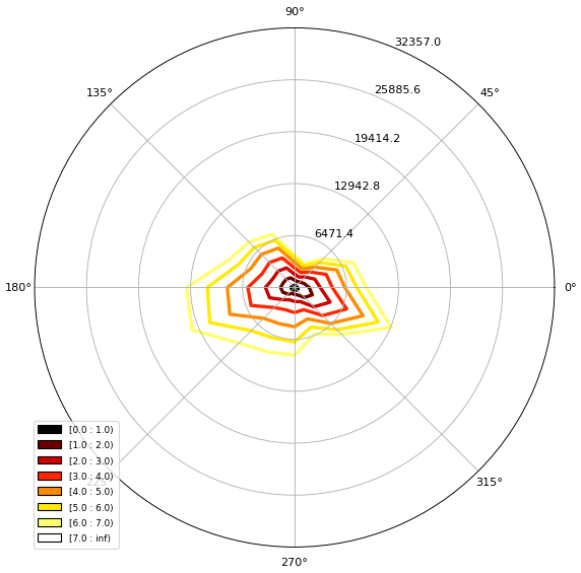
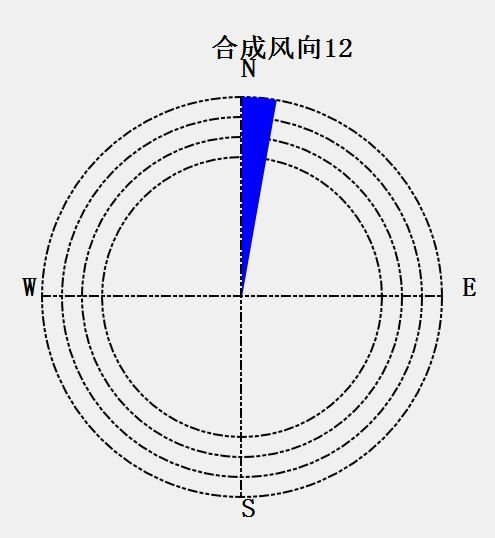
1. The final renderings
2. Source code
import pandas as pd
import numpy as np

import matplotlib.pyplot as plt

# Set font format
font = {
    'family': 'serif',
    'serif': 'Times New Roman',
    'weight': 'normal',
    'size': 10
}
plt.rc('font', **font)
plt.rc('axes.unicode_minus: False')


def plot_wind_rose():
    "" Draw the wind speed to the rose map "" "" "" "
    # In 16 directions
    columns = 'N NNE NE ENE E ESE SE SSE S SSW SW WSW W WNW NW NNW'.split()
    # 4 sections, each column of data represents the frequency statistical value of wind speed in each direction
    datas = {
        '0~0.2': [0.32, 0.24, 0.21, 0.38, 0.35, 0.22, 0.06, 0.28, 0.43, 0.43, 0.18, 0.16, 0.19, 0.23, 0.08, 0.18],
        '0.3~1.5': [0.32, 0.38, 0.28, 0.08, 0.12, 0.29, 0.30, 0.32, 0.31, 0.19, 0.33, 0.49, 0.30, 0.18, 0.40, 0.35],
        '1.6~3.3': [0.24, 0.18, 0.07, 0.39, 0.34, 0.17, 0.40, 0.25, 0.07, 0.24, 0.24, 0.13, 0.10, 0.28, 0.41, 0.21],
        '3.4~5.4': [0.10, 0.18, 0.42, 0.13, 0.18, 0.29, 0.22, 0.13, 0.17, 0.12, 0.23, 0.19, 0.40, 0.30, 0.09, 0.25]
    }
    df = pd.DataFrame(data=np.array(list(datas.values())), index=list(datas.keys()), columns=columns)
    # Get the angle value of the 16 direction
    degrees = np.linspace(0, 2 * np.pi, len(columns), endpoint=False)
    # Draw the width of the fan type, you can adjust it by yourself
    width = np.pi / len(columns)
    # Start drawing
    plt.figure(figsize=(6, 6))
    ax = plt.subplot(111, projection='polar')
    for idx in df.index:
        # Draw a fan in each line
        ax.bar(degrees, df.loc[idx], width=width, bottom=0.0, label=idx, tick_label=columns)
    # Set zero direction north
    ax.set_theta_zero_location('N')
    #
    ax.set_theta_direction(-1)
    # PLT.TITLE ('Wind speed wind direction rose map')
    # Display the label and adjust the position
    plt.legend(loc=4, bbox_to_anchor=(1.15, -0.07))
    plt.show()


def main():
    plot_wind_rose()


if __name__ == '__main__':
    main()
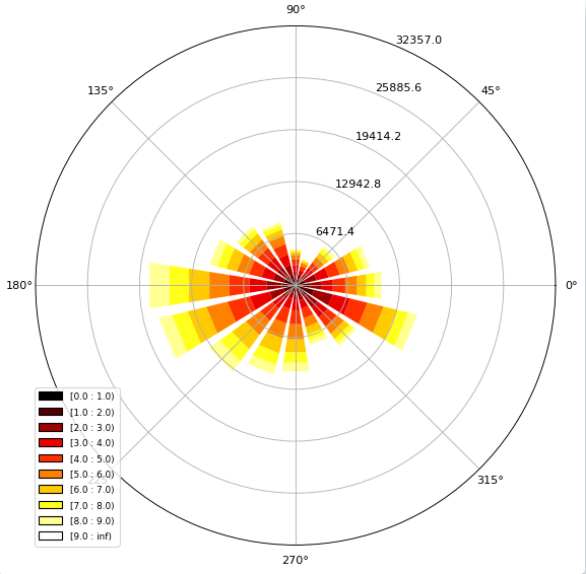
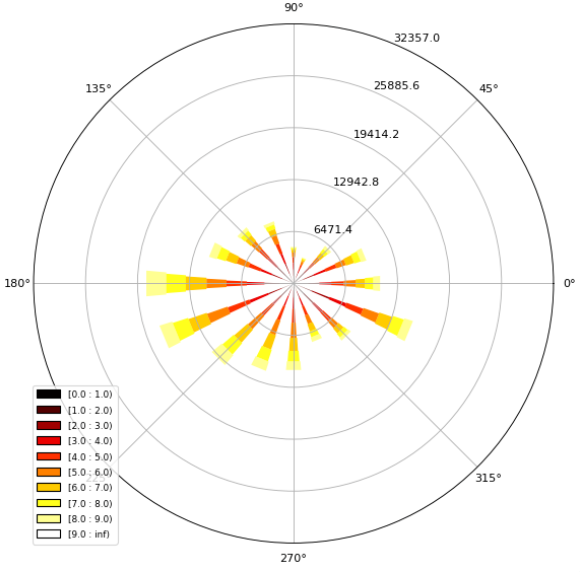
3. Another way can be usedwindroseModule drawing
- For details, please refer to this blogPython visualization | Various wind rose map visualization collection
Intelligent Recommendation
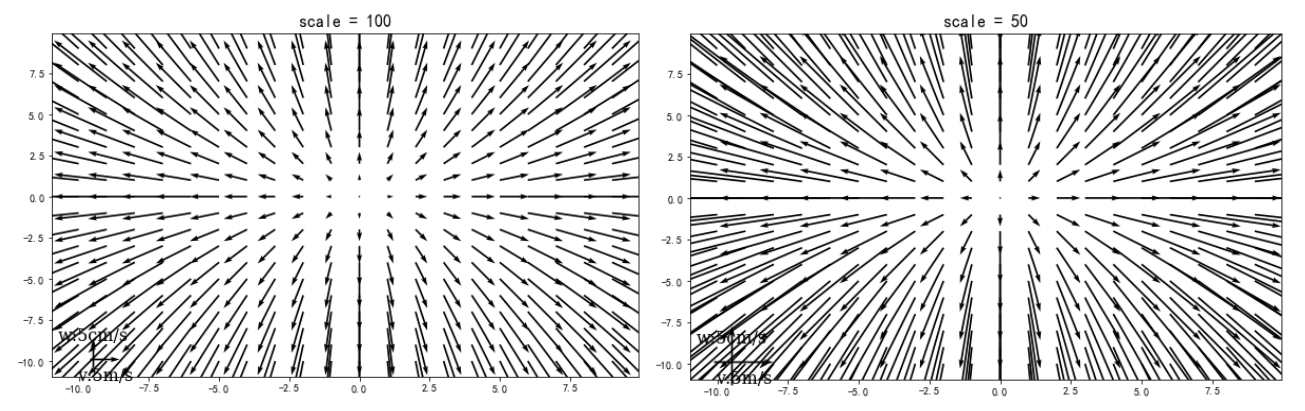
Introduction to using quiver and quiverkey of python matplotlib to draw wind field
Introduction to quiver Article Directory Introduction to quiver 1 quiver official website example 2 quiver and quiverkey parameter examples 2.1 quiver common parameters 2.2 Introduction to quiverkey p...
With the wind
20190119 20190111...
Davenport wind speed spectrum
Davenport wind speed spectrum Single point time history simulation based on Davenport wind speed spectrum Energy center of gravity correction procedure for sharing discrete spectra...
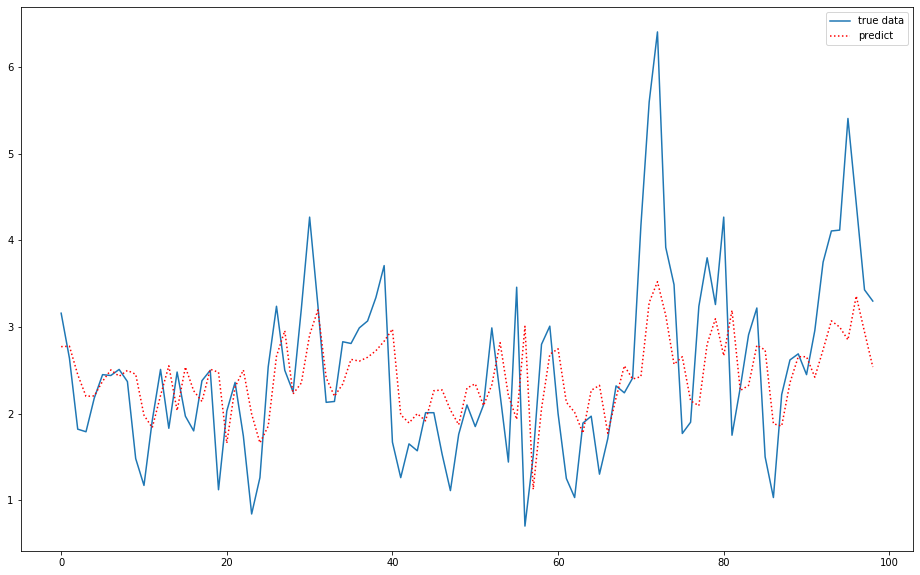
LSTM predict wind speed
Import Data wind/m/sec 0 2.67 1 2.73 2 2.26 3 1.44 4 2.17 ... ... 995 4.12 996 5.41 997 4.43 998 3.43 999 3.30 1000 rows × 1 columns Data amuction, structure training data structure Division Tra...
More Recommendation
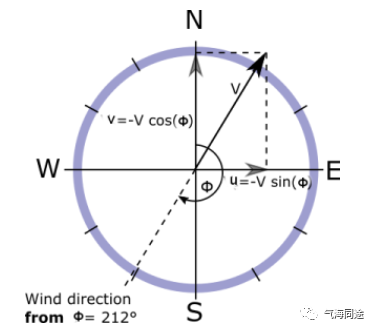
U, V wind and wind speed wind direction mutual conversion
Definition of wind direction Wind direction refers to the direction of the wind. The meteorological general definition is 0 in the north direction, and the clockwise moves. Wind direction dir = 0 °...
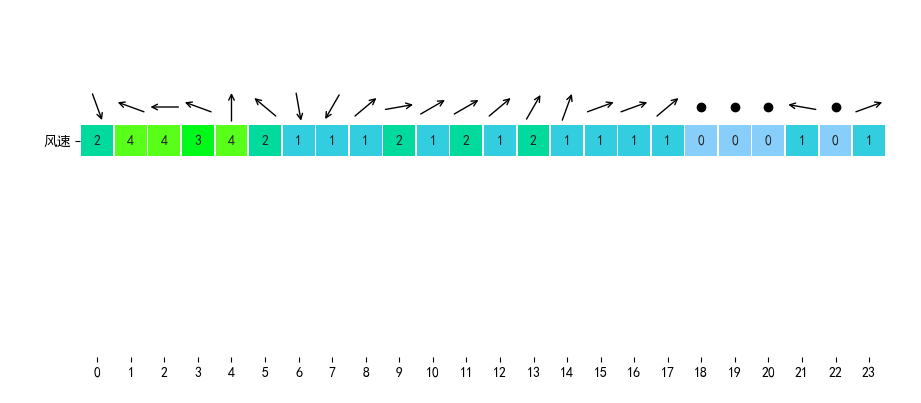
Python uses a single line of thermal drawing to draw a good wind direction
Python uses a single line of thermal drawing to draw a good wind direction Import required support library Praquely draw a single line of thermal chart to express the wind speed Set canvas Set wind sp...
Qt draws a simple wind rose diagram code
1. Draw a simple wind rose diagram code 2. Mainly use QPainter 3. To draw on the sub-widget, you need to use the widget to monitor events eventfilter update();//Update the interface...