Log management graylog
tags: Study notes share graylog elasticsearch search engine
Graylog open source version official website: https://www.graylog.org/
Graylog document:https://docs.graylog.org/docs
Graylog's architecture direction
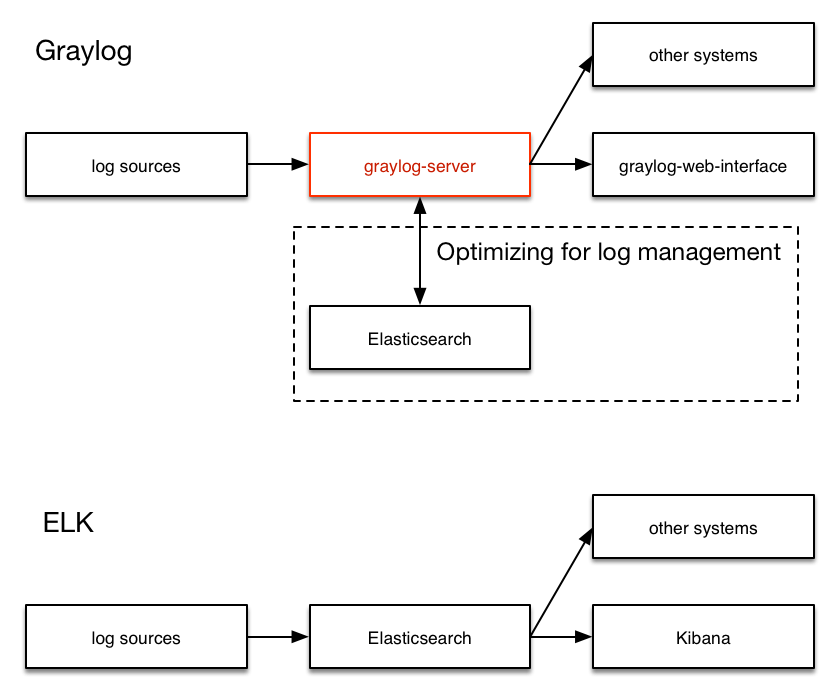
Graylog is the closest to the Splunk architecture:
-
Graylog is a log management system built separately from the first line code. This makes it very efficient and easy to use.
-
Should
graylog-serverThe component is located in the middle, solving the shortcomings of Elasticsearch (full text search engine instead of log management system) in log management. It also built an abstract layer on it to make the data access as much as possible without choosing an index and writing a tedious time range to select the filter-just submit search and query, Graylog will deal with you the remaining things for you Essence -
All parts of the system are closely integrated, and many parts communicate with each other to make your work easier.
-
Just like WordPress makes MySQL a good blog solution, Graylog makes Elasticsearch a good log record solution. You should never use the system or front -end query Elasticsearch for log management, so we put it in
graylog-serverFront.
Graylog's deployment diagram
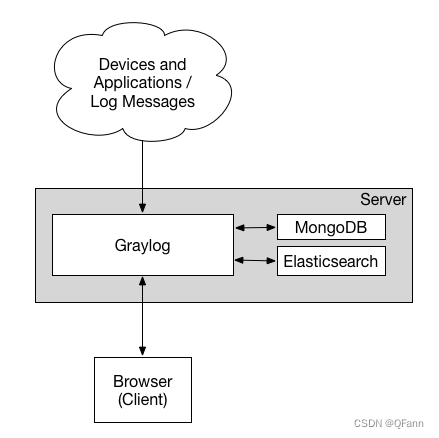
Minimum deployment diagram:
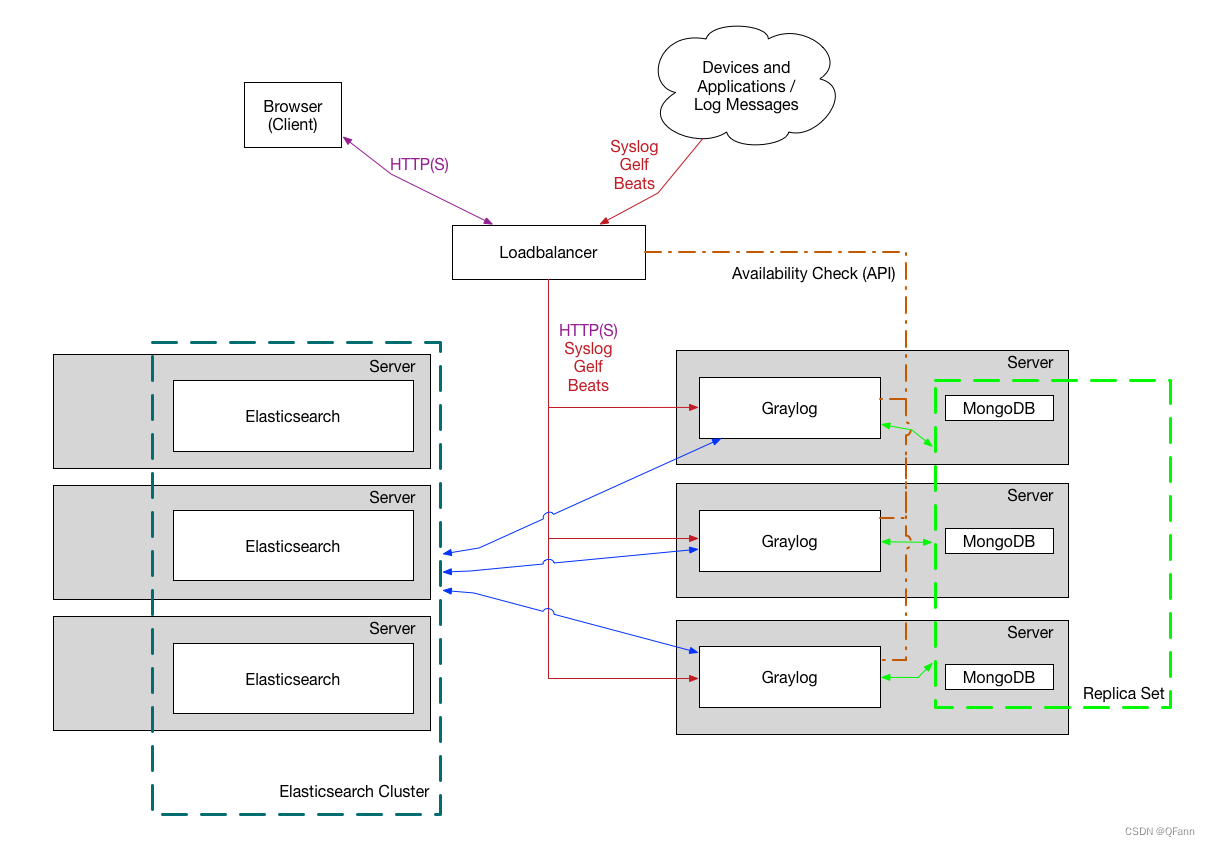
Production cluster deployment diagram
Graylog's deployment steps
Graylog includes four parts:
-
mongodb
-
elasticsearch
-
graylog-server
-
graylog-web
1. Environmental preparation
I use heredocker-composeMethod starts
The official provides multiple versions of docker-compose.yml files to choose from.
Official connection:https://docs.graylog.org/en/3.3/pages/installation/docker.html
version: '3'
services:
    # MongoDB: https://hub.docker.com/_/mongo/
    mongo:
      image: mongo:4.2
      networks:
        - graylog
    # Elasticsearch: https://www.elastic.co/guide/en/elasticsearch/reference/7.10/docker.html
    elasticsearch:
      image: docker.elastic.co/elasticsearch/elasticsearch-oss:7.10.2
      environment:
        - http.host=0.0.0.0
        - transport.host=localhost
        - network.host=0.0.0.0
        - "ES_JAVA_OPTS=-Dlog4j2.formatMsgNoLookups=true -Xms512m -Xmx512m"
      ulimits:
        memlock:
          soft: -1
          hard: -1
      deploy:
        resources:
          limits:
            memory: 1g
      networks:
        - graylog
    # Graylog: https://hub.docker.com/r/graylog/graylog/
    graylog:
      image: graylog/graylog:4.2
      environment:
        # CHANGE ME (must be at least 16 characters)!
        - GRAYLOG_PASSWORD_SECRET=somepasswordpepper
        # Password: admin
        - GRAYLOG_ROOT_PASSWORD_SHA2=8c6976e5b5410415bde908bd4dee15dfb167a9c873fc4bb8a81f6f2ab448a918
        - GRAYLOG_HTTP_EXTERNAL_URI=http://127.0.0.1:9000/
      entrypoint: /usr/bin/tini -- wait-for-it elasticsearch:9200 --  /docker-entrypoint.sh
      networks:
        - graylog
      restart: always
      depends_on:
        - mongo
        - elasticsearch
      ports:
        # Graylog web interface and REST API
        - 9000:9000
        # Syslog TCP
        - 1514:1514
        # Syslog UDP
        - 1514:1514/udp
        # GELF TCP
        - 12201:12201
        # GELF UDP
        - 12201:12201/udp
networks:
    graylog:
      driver: bridge
You need to pay attention hereGRAYLOG_HTTP_EXTERNAL_URI This configuration item is the path of the web page. If it is locally, LocalHost or 127.0.0.1 can be specified. If it is a remote visit, you need to fill in the external network IP.
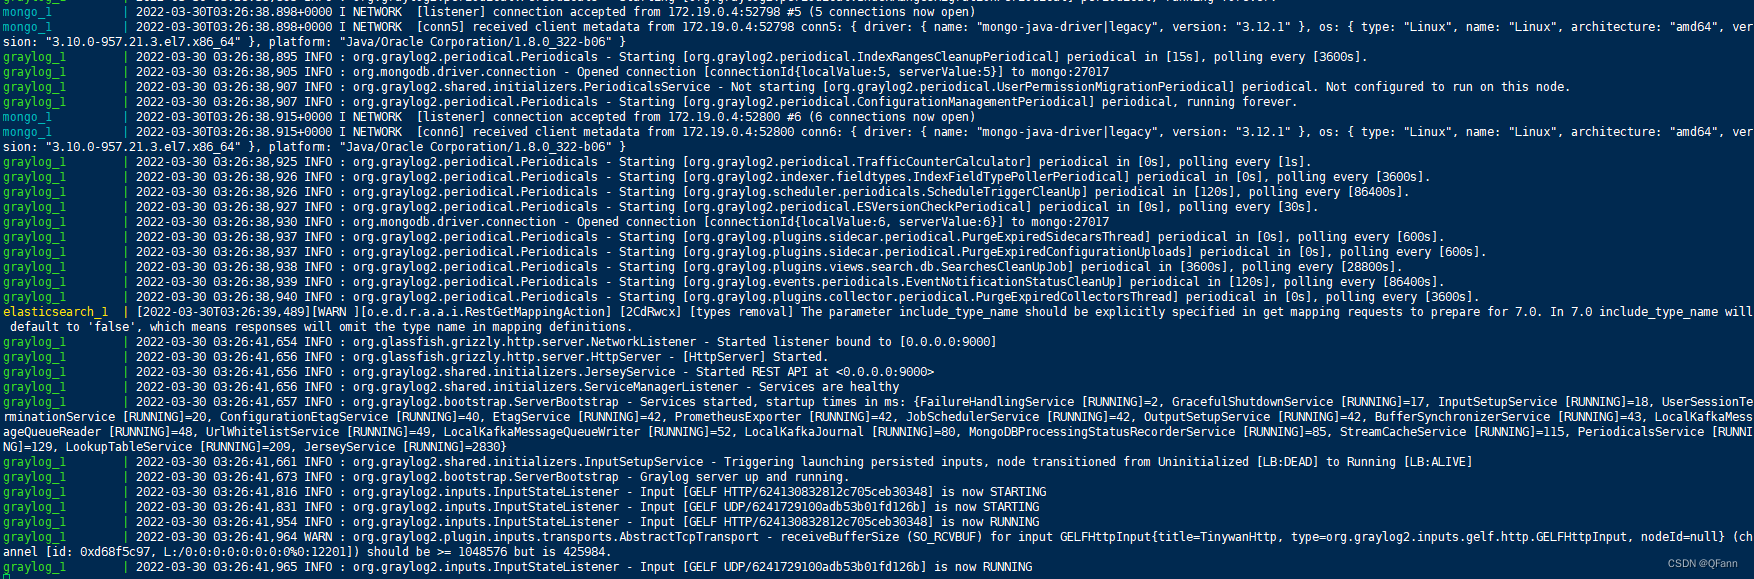
2. Start the container
pass docker-compose up Launch container
3. Login console
Through the previous configuration fileGRAYLOG_HTTP_EXTERNAL_URI The specified path login page

SpringBoot integrates Graylog
1. Add pom dependencies
<!-Provide logback transmission logs to Graylog's dependence->
		<dependency>
            <groupId>de.siegmar</groupId>
            <artifactId>logback-gelf</artifactId>
            <version>2.0.0</version>
        </dependency>
2. Modify logback.xml
Support TCP and UDP methods, here is UDP examples
For specific description information, see the official website:https://github.com/osiegmar/logback-gelf
<!-Graylog log collection->
  <appender name="GELF" class="de.siegmar.logbackgelf.GelfUdpAppender">
    <graylogHost>localhost</graylogHost>
    <graylogPort>12201</graylogPort>
    <maxChunkSize>508</maxChunkSize>
    <useCompression>true</useCompression>
    <encoder class="de.siegmar.logbackgelf.GelfEncoder">
      <includeRawMessage>true</includeRawMessage>
      <includeMarker>true</includeMarker>
      <includeMdcData>true</includeMdcData>
      <includeCallerData>false</includeCallerData>
      <includeRootCauseData>false</includeRootCauseData>
      <includeLevelName>true</includeLevelName>
      <shortPatternLayout class="ch.qos.logback.classic.PatternLayout">
        <pattern>${GRAY_LOG_SHORT_PATTERN}</pattern>
      </shortPatternLayout>
      <fullPatternLayout class="ch.qos.logback.classic.PatternLayout">
        <pattern>${GRAY_LOG_FULL_PATTERN}</pattern>
      </fullPatternLayout>
      <staticField>app_name:${APP_NAME}</staticField>
      <staticField>os_arch:${os.arch}</staticField>
      <staticField>os_name:${os.name}</staticField>
      <staticField>os_version:${os.version}</staticField>
    </encoder>
  </appender>

  <root level="INFO">
    <appender-ref ref="GELF" />
  </root>
3. Set source information
4. Start project
The main difference between Graylog and ELK
-
ELK Stack; it uses elastic search collection, index and storage data; logstash is a tool that analyzes all information stored in elastic search; this information may be log data. All the inferences and observations they do are visualized by Kibana using their interactive quit board. Elk Stack is mainly focused on big data analysis, while Graylog is specifically used for log analysis. Unlike ELK, it only processes log data.
-
Visualization is completed by Kibana in ELK; Kibana must set up separately with others. Graylog is a complete package for processing and visualization. Its GUI is more interactive and user -friendly than Kibana. In terms of log analysis, Graylog is very powerful.
-
Elk Stack and Graylog are open source tools to a certain extent. Users can experience themselves and continue to support. All advanced functions are authorized.
-
Graylog is used in many security applications and is concentrated. Since all data are concentrated, you can analyze large -scale (TB) data from multiple log sources and multiple geographical location, so you can access it anywhere.
Log analysis process in ELK:
-
In most interested in log analysis, Elk Stack uses FileBeat (a lightweight tool for concentrating all logs) to place all logs to specific servers.
-
All data that FileBeat is pushing is pushed to Logstash for processing. Logstash is very light and flexible. It can be integrated with multiple plug -ins, but at the cost of performance.
-
Although Logstash is easy to use, it is difficult to process high data data due to its limitations.
-
All logstash processing data will be sent to Kibana for visualization. It is very interactive, allowing users to define the type of visualization they choose. In addition to the data, it also provides statistical information about the behavior of the application in the production environment.
Log analysis process in Graylog:
-
Graylog is mainly composed of three components, namely MongoDB, Graylog's main server and Graylog Web interface.
-
The Graylog client has a specific configuration to achieve server-client communication. The client pushes log data to the server, and the server is analyzed and stored in MongoDB.
-
Graylog Web UI is very user -friendly; it provides control of user permissions. It uses Restful API.
-
Web UI can support a variety of data types, while Graylog does not support system logs. Data should be sent directly to Graylog. This makes the log management in the dashboard difficult.
Graylog vs Elk comparison table
| Graylog | ELK |
|---|---|
| Do not accept system log files. Data should be sent directly. | ELK supports most data types, such as JSON. You can use a third -party plug -in for data conversion. |
| Developed for log management and log analysis. | ELK stack supports log management and log analysis and other functions. It is a multi -purpose stack. |
| Graylog is very powerful in processing logs. | LOGSTASH is part of the ELK stack. It is not as fast as Graylog, and problems occur when there is high traffic data. |
| Development with Java and support GLEF (Graylog expansion log format) | ELK stack is also developed in Java and supports JSON format. |
| Support real -time UDP log record/GLEF log records and intuitive search. | A full -text query search analysis supports elastic search. |
| Use Lucene syntax as its search language | Use Lucene as a Query DSL based on its search language. |
| Built -in alarm available. Alarm is based on stream data. Custom alarm filters can be configured in the Graylog Web interface. | The built-in alarm is unavailable, but a third-party plug-in such as X-PACK can send an alert to the user. |
Intelligent Recommendation
Graylog log installation documentation
Graylog log collection system Installation environment: Linux CentOS 7, JDK1.8, PWGEN command Elasticsearch installation (1) Planning and installation directory (2), download and install bags Visit th...
graylog use of the collected log off
The original article address: Original written very clearly, we can go to learn next, just below me I had to write error-prone points. 1. Some software is not installed on the cause of the environment...

Container log monitoring based on Graylog
Docker logs When a container is started, it is actually a child process of docker deamon. The docker daemon can get the standard output of the process in the container and then process it through its ...
Self-built log system-graylog
1. Introduction Graylog is a popular online log system that is more convenient to build by yourself. Second, deployment There are many ways to deploy graylog, it is recommended to use docker installat...
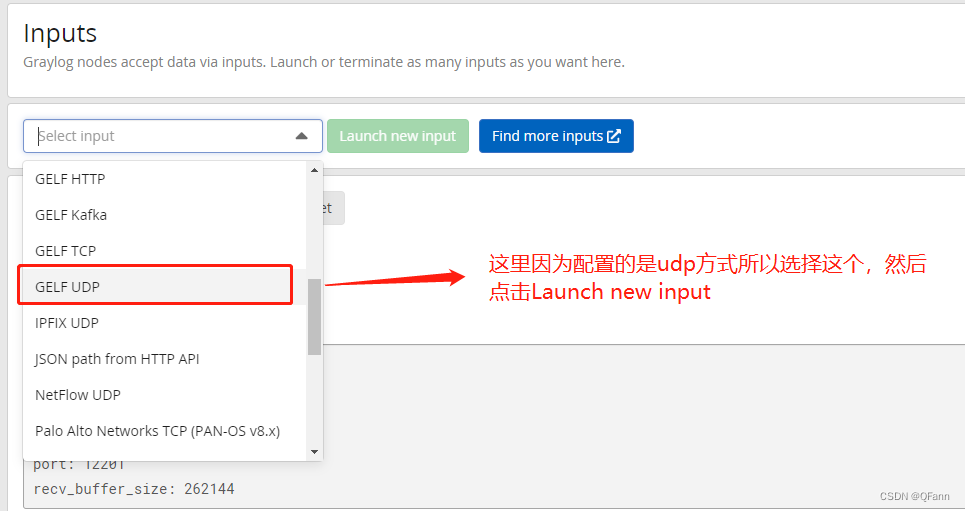
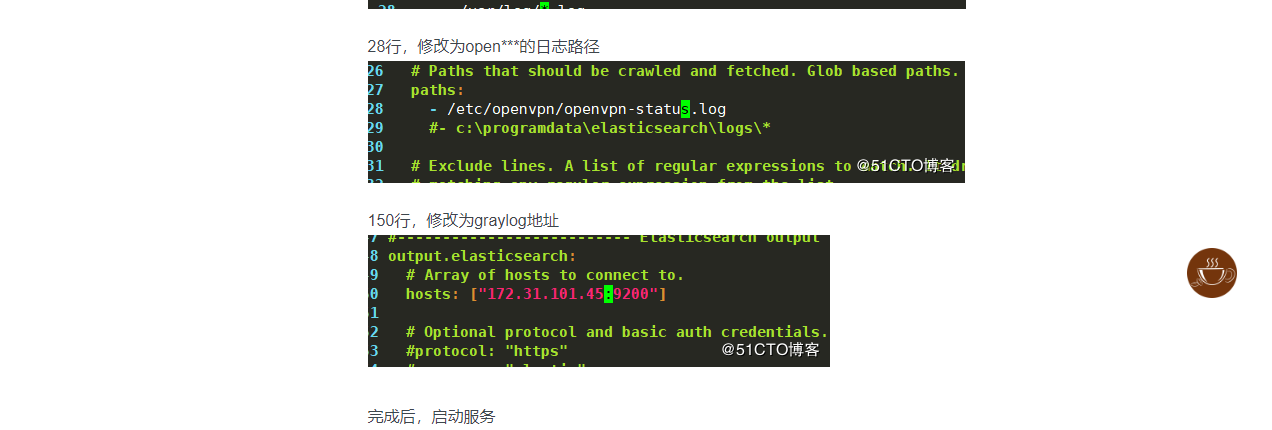
Graylog log push method -gelf
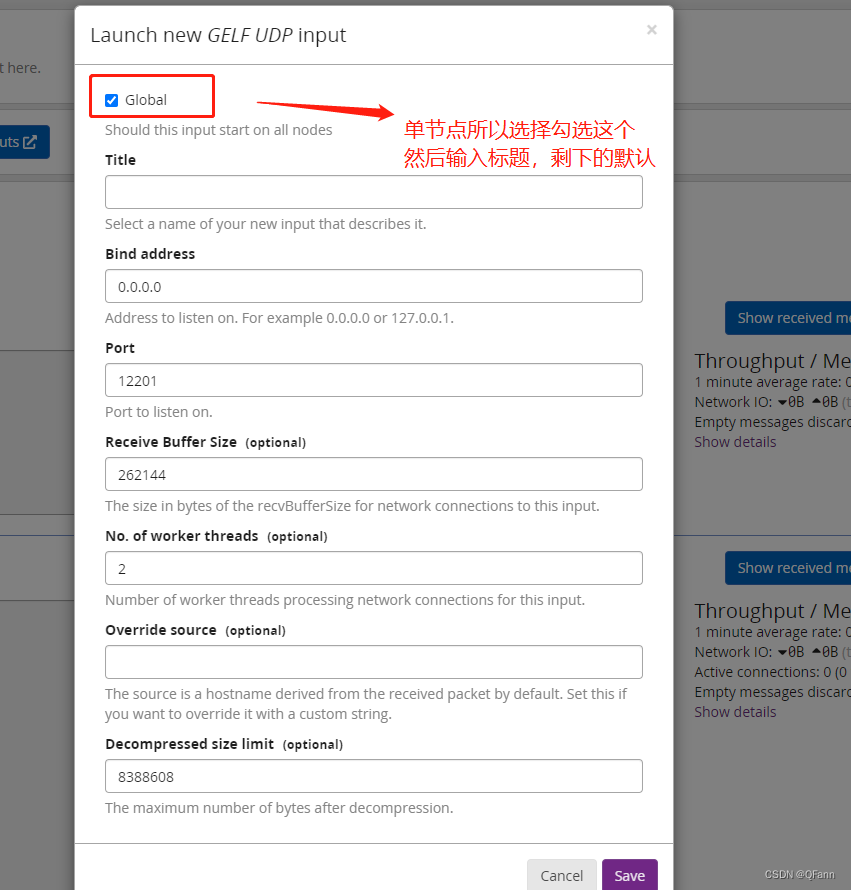
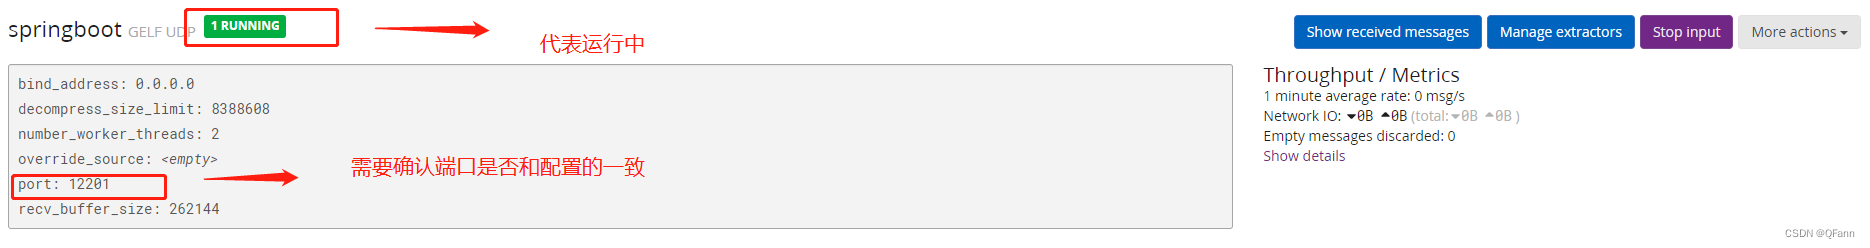
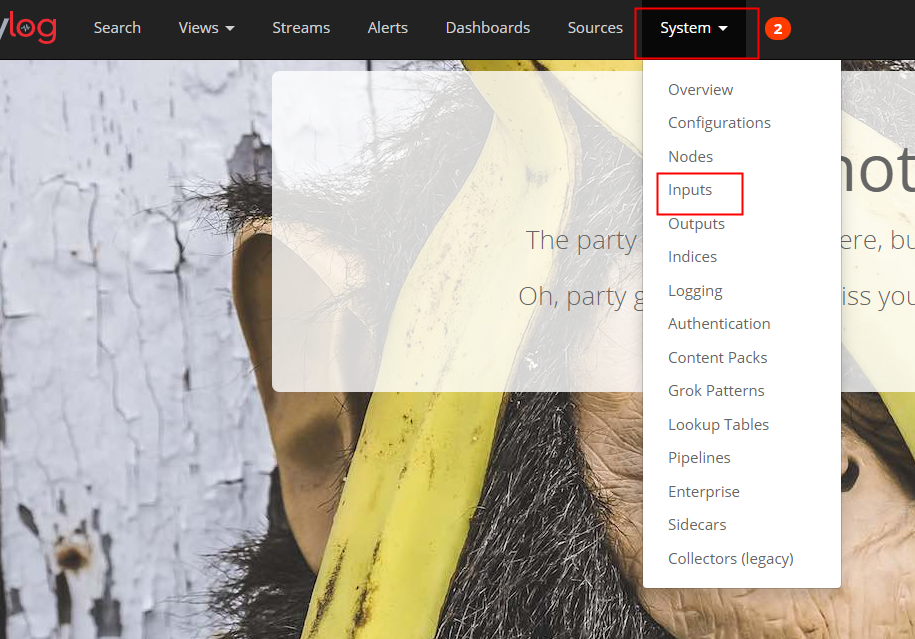
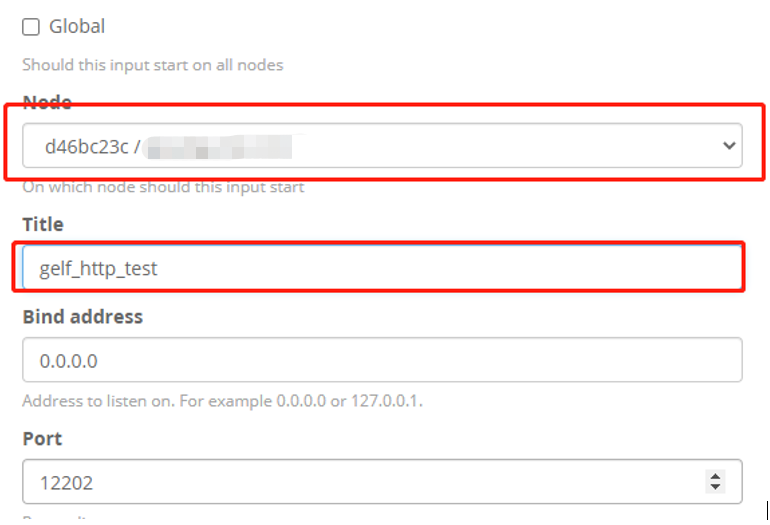
Graylog log push method -gelf First, open mode Use the administrator account, log in to the GrayLog's web page, select Input in System Select a Gelf Push, then click Launch New INPUT to create a new i...
More Recommendation
Springboot integration graylog log collection
Project Integration GrayLog Configuration Add dependence Add GrayLog configuration in the logback-spring.xml configuration file Mainly Host and Port, which refers to the port of the GrayLog collection...
NodeJS Application GrayLog Log System
Introduction installation Enter the web side for configuration Nodejs Previously, the log system prepared for ELK (Elasticsearch, Logstash, Kinaba), recently seen the Graylog log system. Introduction ...
SpringBoot integrated Graylog log platform
I have always wanted to build an ELK log platform, but the various configurations between ELK components make people feel that it is not easy to use. Then I discovered that Graylog's log management an...
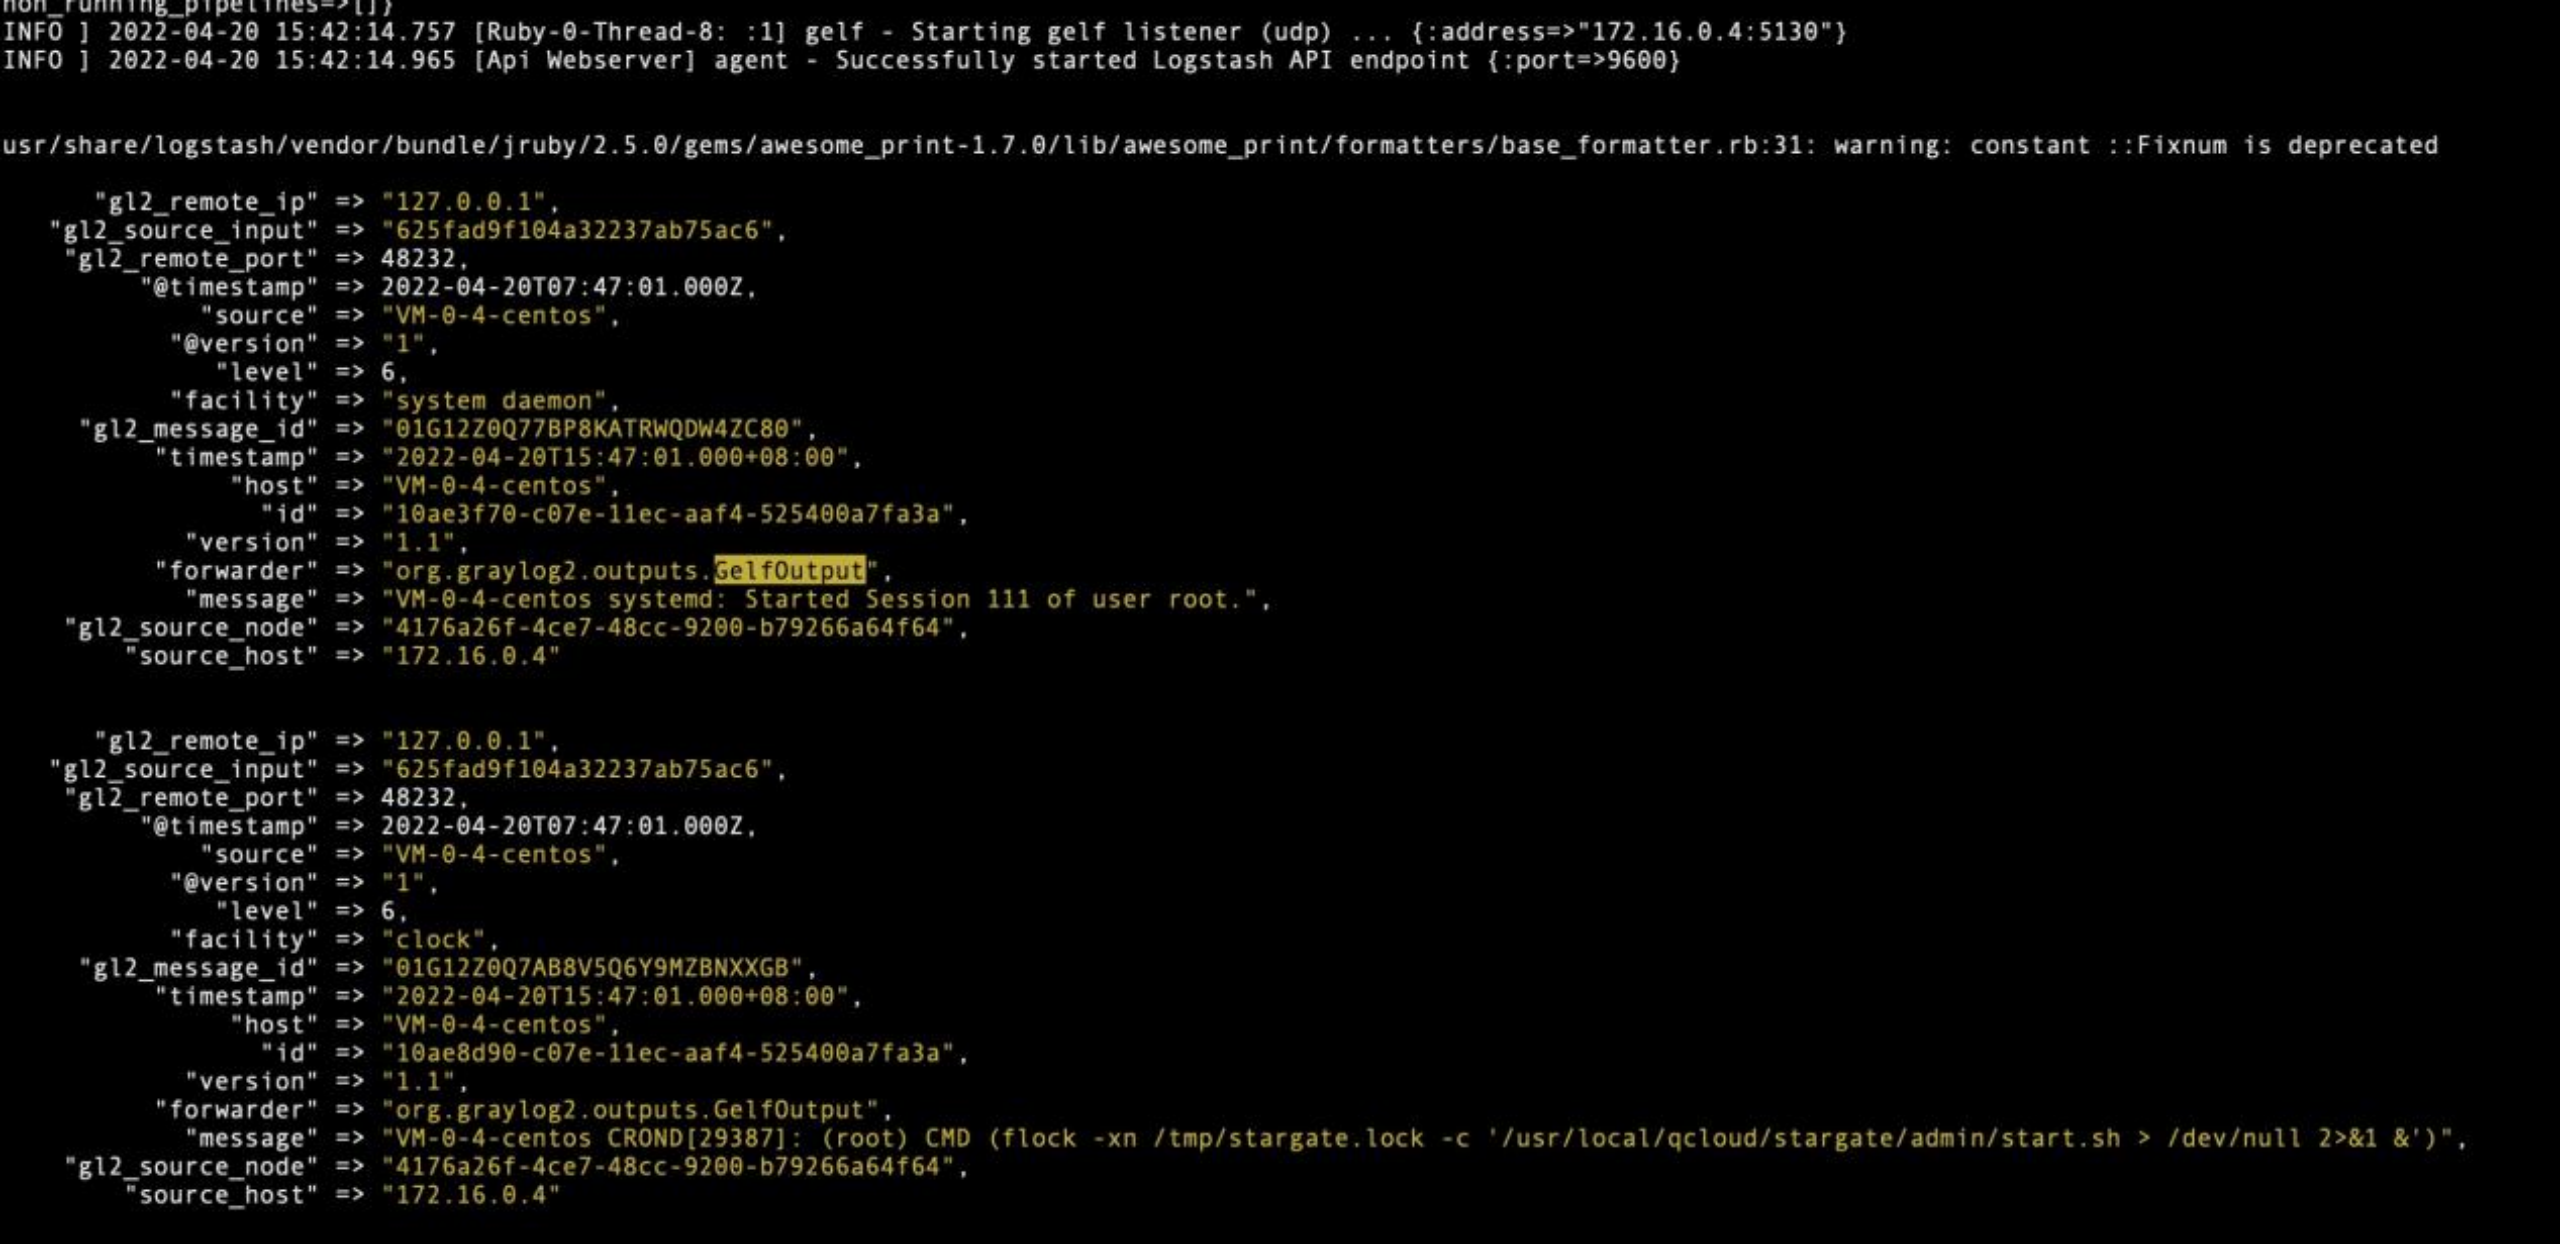
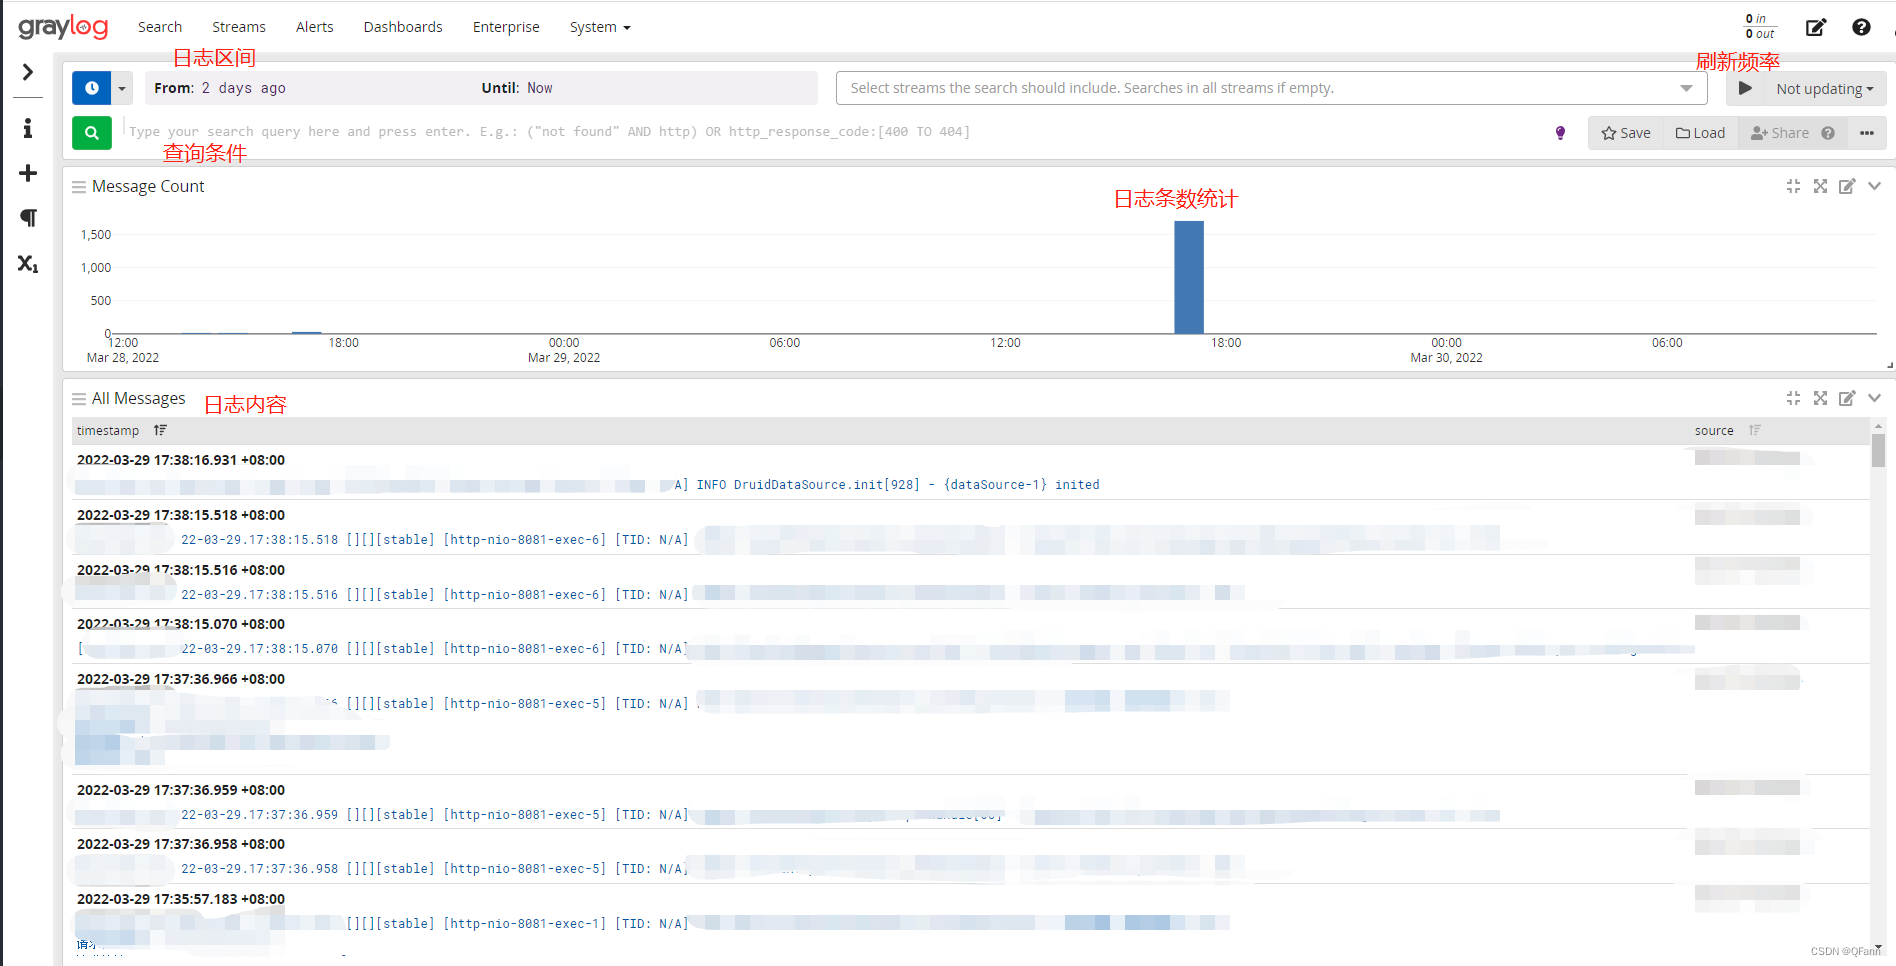
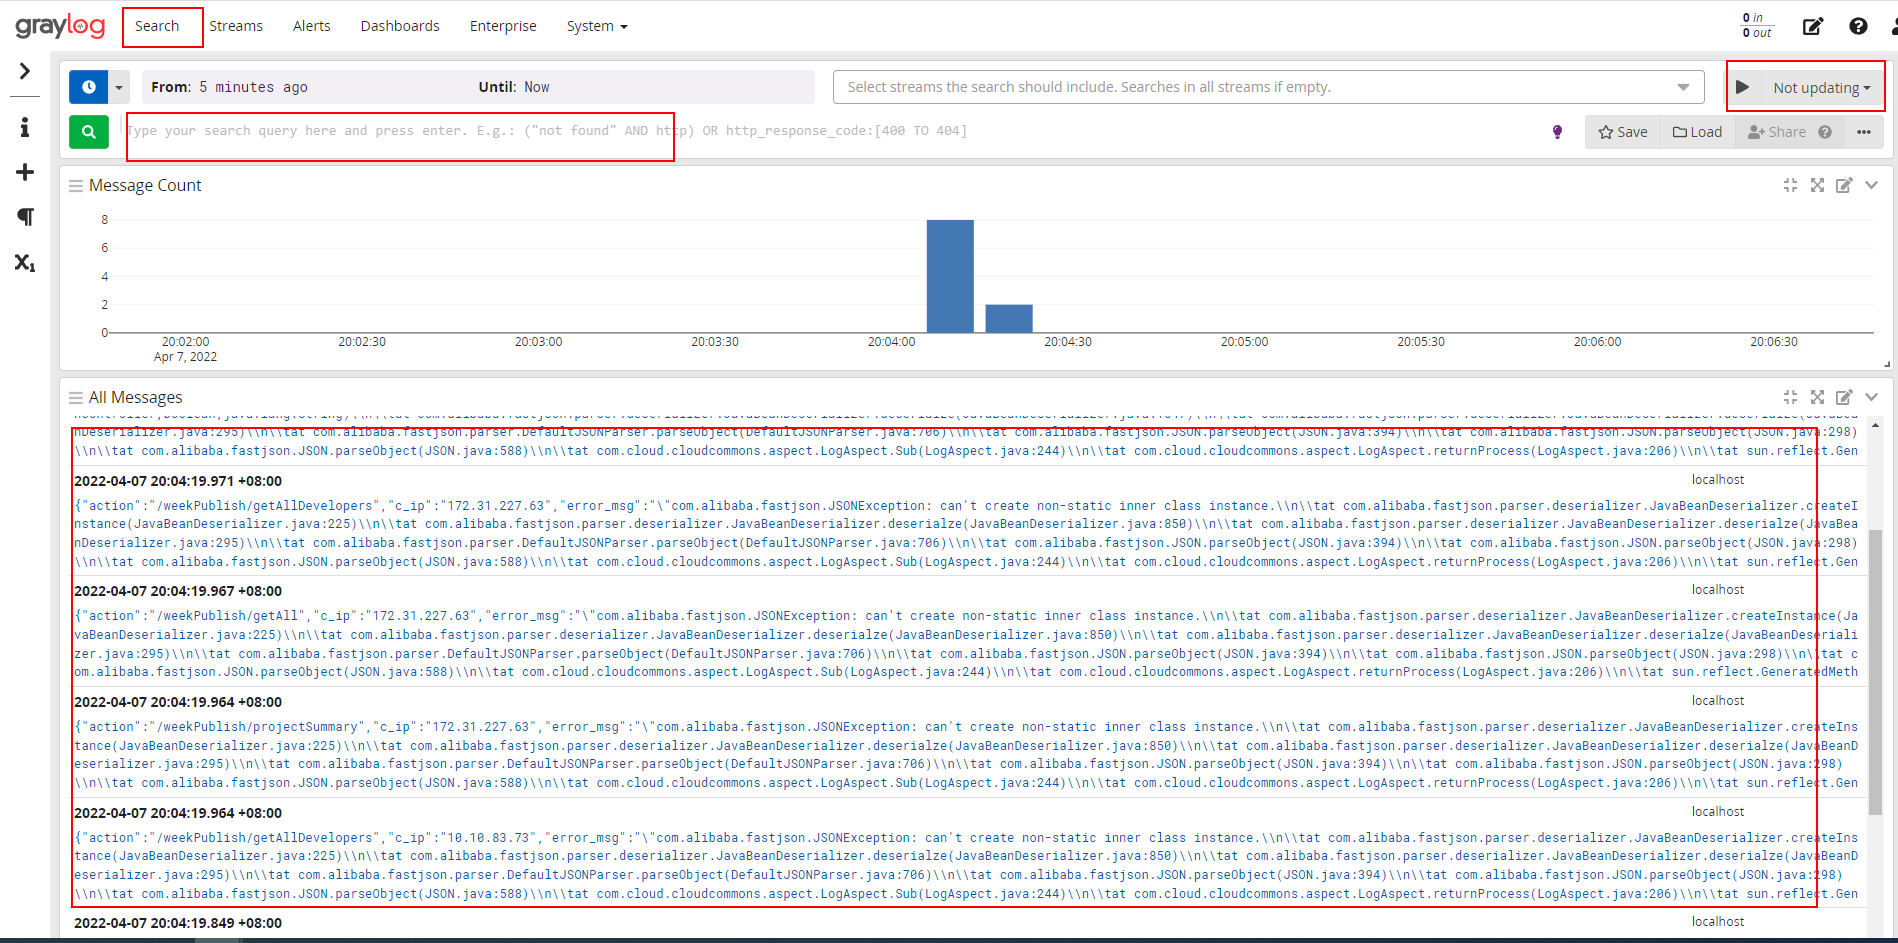
Graylog platform log output test
1. Collection environment The customer environment version is Graylog 3.3.8 version, so the test environment is also deployed as Graylog 3.3.8 Deployment environment: CentOS7.6 JDK:1.8 &n...
How to use the new generation of lightweight distributed log management artifact Graylog to collect logs
Public account follow "Wonderful Linux World" Set as "Star", take you to linux every day! When our company deploys many services as well as testing and formal environment, viewing ...