AutoCAD in Python 3: Automate CAD drawing with the pyautocad library
The author is actually a machine learning algorithm engineer. The most painful thing in the work is to label data. And I have encountered more than just label categories, labels, etc. I need to mark the partition polygons of the restaurant and living room in the floor plan. This requires me to read the floor plan data (that is, the coordinate points) and then draw the picture. After the analysis, the partition frame is actually used to find the partition coordinates. The task of this project is still very large, and the difficulty is not low. It is more difficult to label data. I need to write a script, otherwise I know where to mark the coordinates. I don't think much of the various drawing tools. I just want to develop a partitioning tool. The core is to use the pyautocad library to draw the existing coordinate points, add the rectangular box on the CAD software, and then use the program to set the partition coordinates. Read out and automatically write to the floor plan format file. So all I need to do is look at the simple data annotation work of the house picture frame.
The core of the project is still using pyautocad for api operations. There are very few documents on the official website about this library, and the explanations are not complete. I will summarize the various commonly used operations here, which is the operation I used. (To put it bluntly, this library is to input data into the CAD application through the interface for operation, so in the process of drawing, the CAD process must not be closed, the essence is still CAD drawing, and the drawing operation can not be too fast, the CAD application can't react too much. May report an error, this issue remains to be resolved)
Github address of pyautocad:https://github.com/reclosedev/pyautocad
You can see the source code from it, find the basic usage, and find the official documentation. (It is recommended to read it well. In this case, there are fewer solutions. You can’t just look around and have a high chance of getting a bug.)
pyautocad
The pyautocad package can be operated with any version of cad, in fact the interface is the same. The code first connects to cad in the documentation:
from pyautocad import Autocad

# Automatically connect to cad, as long as cad is open, a <pyautocad.api.Autocad> object is created. This object connects to the most recently opened cad file.
# If cad is not open yet, a new dwg file will be created and the cad software will be automatically opened.
acad = Autocad(create_if_not_exists=True)
# acad.prompt() is used to print text in the cad console
acad.prompt("Hello, Autocad from Python")
# acad.doc.Name stores the name of the graphic that cad has recently opened.
print acad.doc.Name
In fact, you can use the interface given in the document to draw, each interface is not difficult to understand, but there are no detailed examples of interface parameters is a headache. The interface I have used is below, I try to write the parameters clearly:
#Importing the APoint class is very necessary. Drawing is done by points, and all points in the CAD must be wrapped with the APoint class. APoint (10,30),
# 10 represents the x coordinate of the point, and 30 represents the y coordinate of the point.
from pyautocad import APoint
import math

# draw a line, p1 is the first point of the line, p2 is the second point
acad.model.AddLine(p1,p2)

# Add text, the first parameter is the added text string, the second p is the point wrapped by the APoint class, which means that the text is displayed under which coordinates, 15 is the text font size
text = acad.model.AddText("{0}".format(text), p, 15)
#Text moves from point p1 to point p2
text.move(p1, p2)

# , the first parameter p is the point of the APoint class package, which is the center position, and the second parameter 10 is the radius.
acad.model.AddCircle(p, 10)

# Draw an arc, the first parameter is at which point to draw the arc, the second parameter is the radius, the third is the starting arc (radian system, not the angle system), and the fourth point is the ending arc.
acad.model.AddArc(p, radius, math.radians(90), math.radians(270))

# Save the cad map to the specified location, the first parameter must be the absolute path saved! ! , 64 is a format saved, the author tried it from 1 to 100,
# There are some files that can be generated, all of which are file type formats that can be opened by CAD. In fact, just follow the author to write 64!
acad.doc.SaveAs("{0}".format(save_path), 64)
Then you can combine Python drawing, for an example (very official):
from pyautocad import Autocad, APoint


acad = Autocad(create_if_not_exists=True)
acad.prompt("Hello, Autocad from Python\n")
print(acad.doc.Name)

p1 = APoint(0, 0)
p2 = APoint(50, 25)
for i in range(5):
    text = acad.model.AddText('Hi %s!' % i, p1, 2.5)
    acad.model.AddLine(p1, p2)
    acad.model.AddCircle(p1, 10)
    p1.y += 10

dp = APoint(10, 0)
# ! ! ! ! ! ! ! Traverse cad graphic objects and access/modify object properties
for text in acad.iter_objects('Text'):
    print('text: %s at: %s' % (text.TextString, text.InsertionPoint))
    text.InsertionPoint = APoint(text.InsertionPoint) + dp

for obj in acad.iter_objects(['Circle', 'Line']):
    print(obj.ObjectName)
The result is:

This method extracts the vertices of PolyLine and helps me with my project. ! ! !
for item in acad.iter_objects("PolyLine"):
    print(item.Coordinates)
'''
(-462.01707322354014, 719.8251441314151, 207.17175903027055, 1056.4031530064085,
389.6778054895749, 574.9096117303479, -143.80140284041954, 434.6687742615859,
-326.30744929972207, -60.84885181138725, -564.9692056597924, 308.45202158973643,
 -327.4641724567995, 461.94033545845366, -593.0470534647193, 546.8614421365228,
 -616.4452718779175, 803.9696476627087)
'''
# The first and second elements form the first coordinate, the 3 and 4 elements form the second coordinate, and so on, and each two elements form a coordinate.
Error reference:

Other details can go to the official website to study carefully, and a CAD drawing of the floor plan ends this technical sharing blog!

Intelligent Recommendation

CAD drawing
CAD page diagram (compare the following icons, you will know the function of the icons) (Picture 1) The (icon, command, shortcut key, command description) in the picture vividly describes the applicat...

AUTOCAD (2) drawing a stereogram
Article directory 1. Delete the picture in the design, leaving only the side elevation 2. Interrupt the desktop between the drawers 3. Click the area button to prepare to create the area. 4. Create a ...
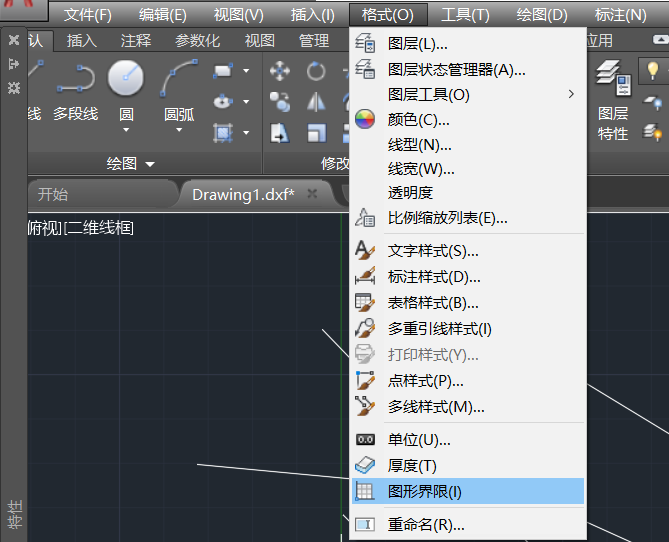
AutoCad set drawing environment
AutoCad set drawing environment Setting up a suitable drawing environment is a necessary preparation step for drawing. Here is a brief description of the drawing environment in two ways: interactive d...
C# AUTOCAD CAD The problem of resolving the CAD in the second development of the CAD
Among them, newtonsoft.json...
Python Arcade Library Basic Tutorial Basic Drawing Method (3)
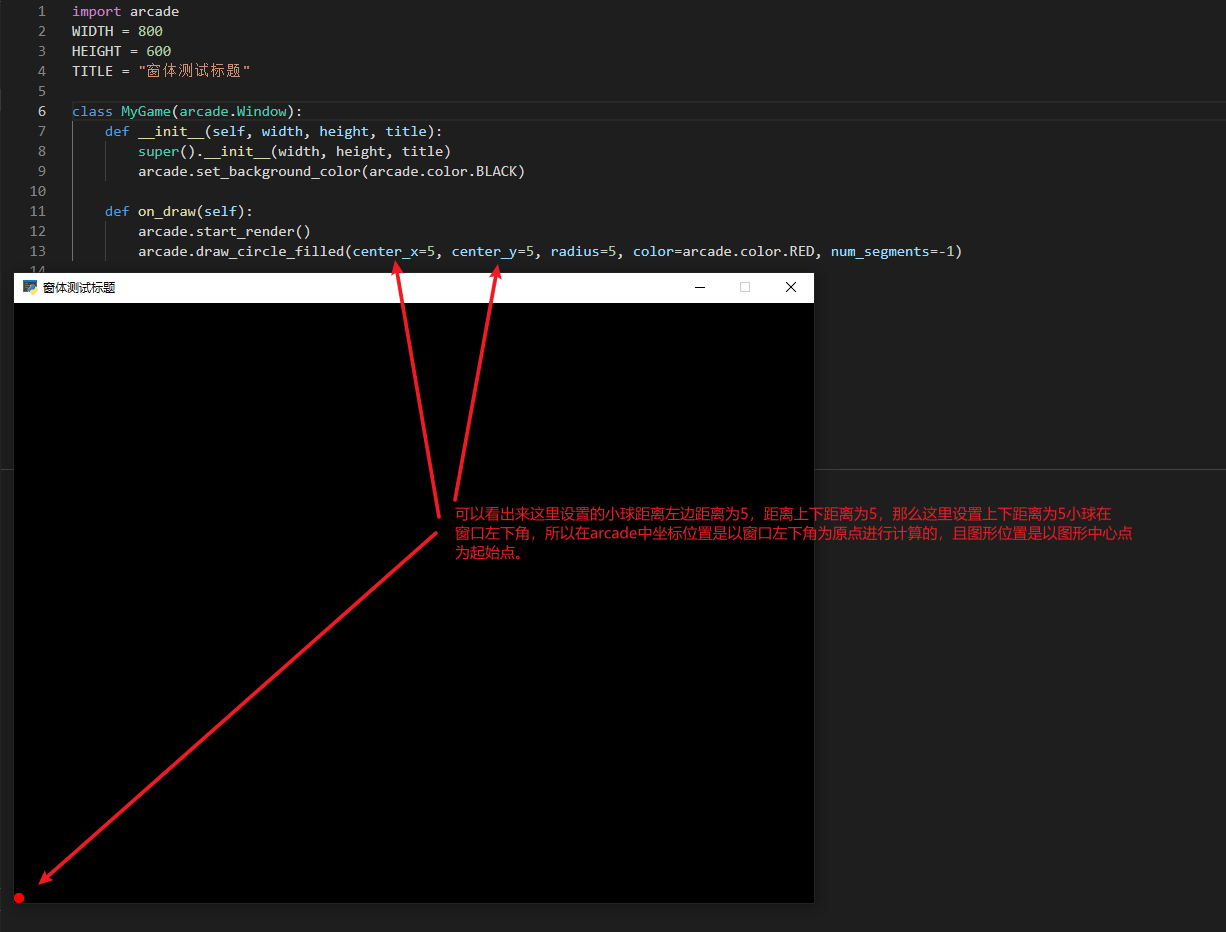
Arcade Basic Drawing Method Before the drawing, the coordinates in Arcade, the coordinates in Arcade are calculated in the right angle coordinate system in mathematics, and is calculated in the lower ...
More Recommendation
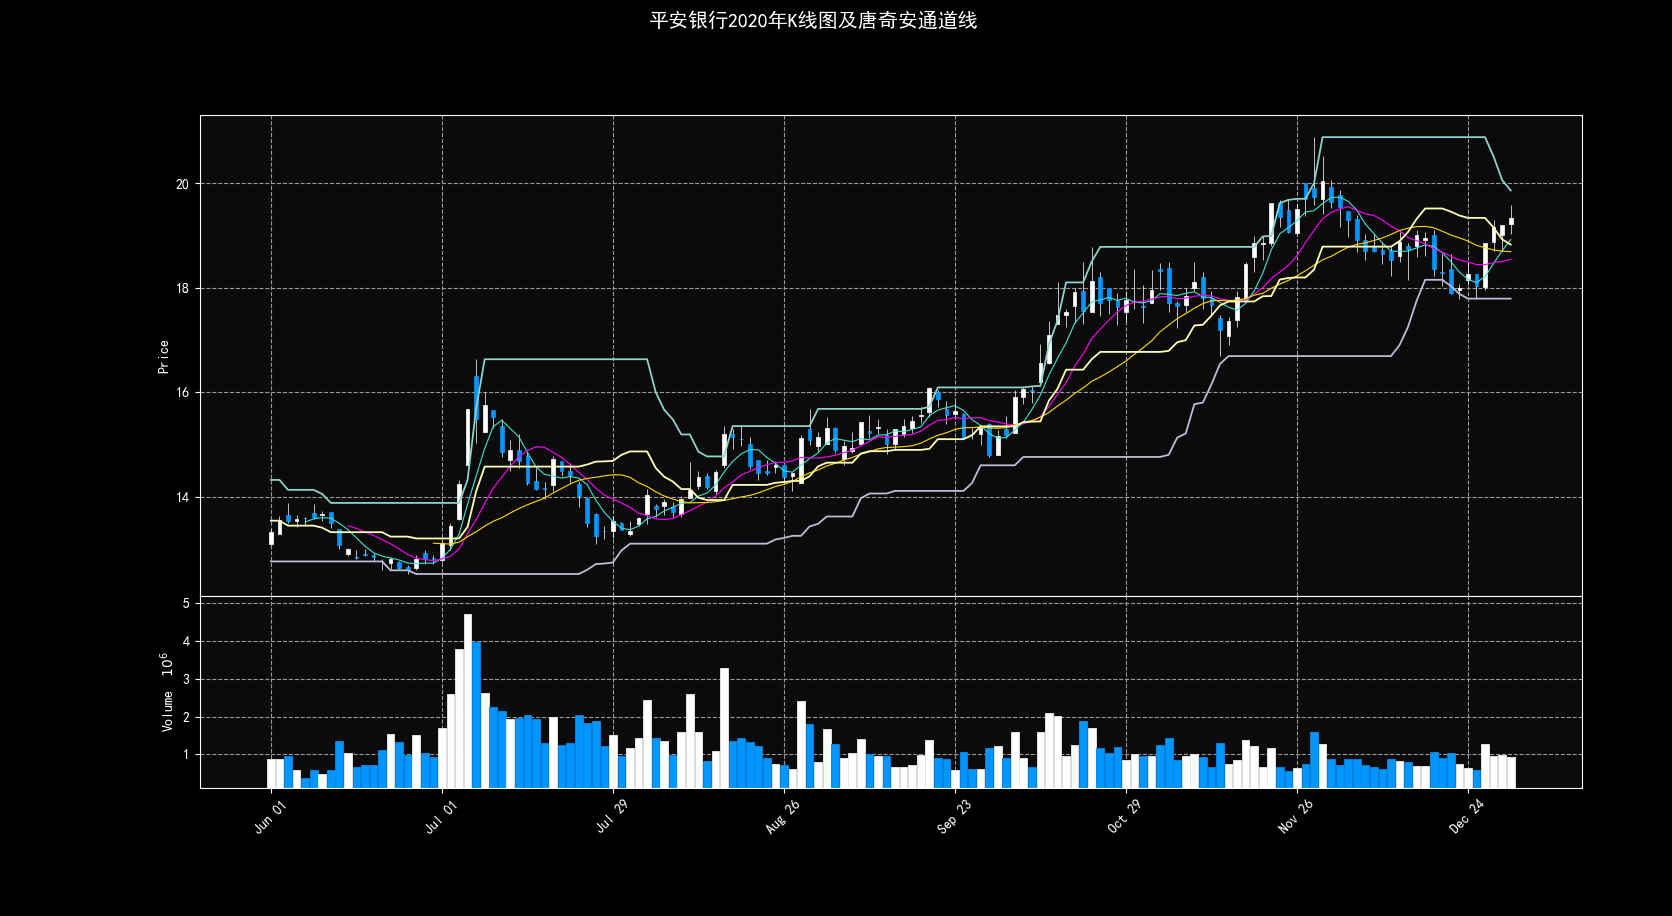
Python MPLFINANCE library 3 How to add another drawing
We know that when using matplotlib.pyplot, we use the idea of object-oriented drawing. First there must be a figure, a panel, then we only need to add various objects on this panel, this image will ...
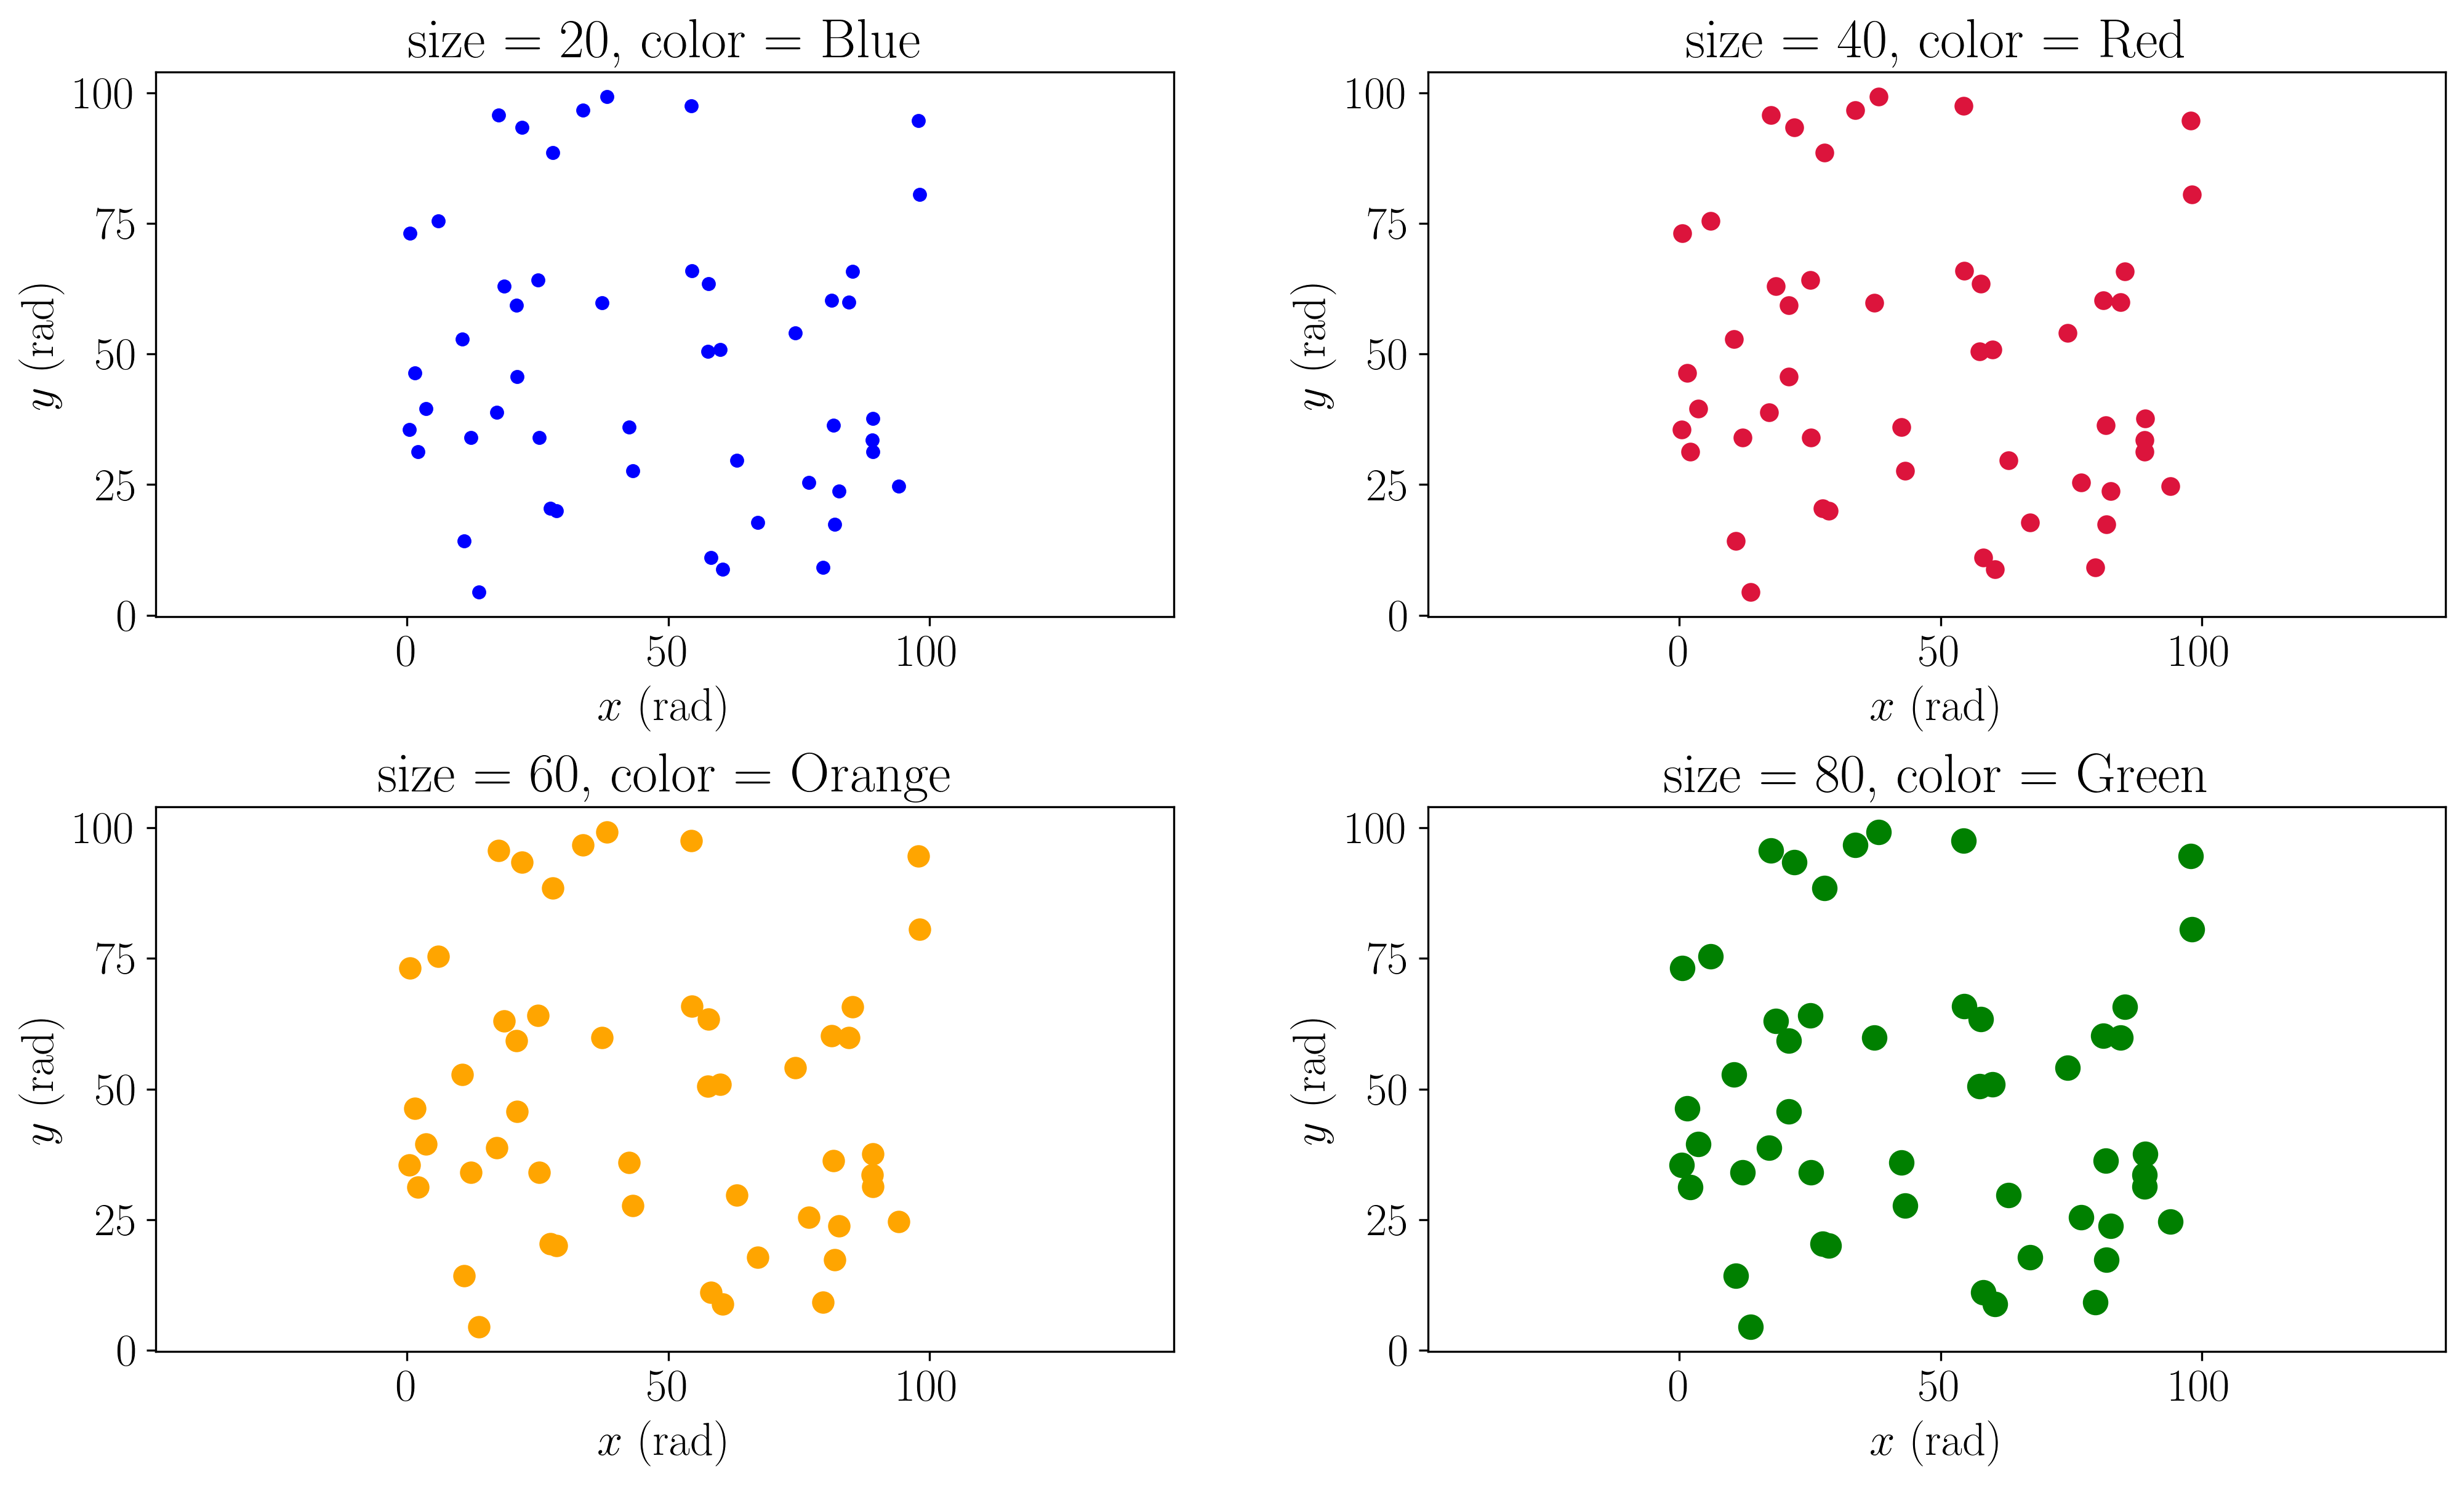
A python function solves the scatter drawing - MatPlotlib library example (3)
Series article catalog Part of this series of articles catalog: A Python function resolves the line drawing - MatPlotlib library example (1) Insert horizontal line and vertical line for images - MatPl...

[Python] Matplotlib drawing library
Matplotlib is Python's 2D&3D drawing library, which produces print quality icons in a variety of formats that have been copied and cross-platform in interactive fantasy. Matplot syntax is similar ...
Turtle library drawing in python
The turtle library function in python contains python drawing functionality, such as the one used in previous Piglet Paige drawings. This library is similar to the canvas canvas in the front end and i...
[python] matlab library drawing
Original blog: Use the matplotlib.pyplot library for drawing. This library is a matlab interface in Python, which is the same as matlab drawing. This library is based on numpy, install numpy and then ...