Code performance analysis-Dottrace tracks code execution time
When my program encounters performance problems, such as slow response requests, how to analyze what went wrong?dottracecan help.netThe program tracks the execution time of each method in the code, so that we can more clearly see where the execution time is too long, and then analyze how to solve it.
DottraceByJetBrainshttp://www.jetbrains.com/ A product developed by the company, it is divided intodottrace Performancewithdottrace Memory Two tools,dottrace PerformanceUsed to analyze code performance, such as function execution time, number of calls, time consumption ratio, etc.dottrace MemoryGenerally used to analyze memory usage.
Introduction of this articledottraceTrack code execution time to analyze performance issues, so I useddottrace Performancetool. It can track.netWritten: application,IISHooked program,windowsservice,silverlight,WCFService procedures, etc. You can also save the tracked file as a snapshot and save it asdtpSuffix files. After tracking the results, if you can find the code information of the corresponding user, you can also directly view the corresponding source code and selectVSDirectly edit the file corresponding to this method.
The following figure is an example of analysis performance tuning:

It can be seen directly from the results that the entire page is loaded6.140Seconds, whereaddPNRInfowithretrievePNRBoth methods are occupied5.92Seconds, and then you can optimize according to these two methods.
Now on the leftViewsUnder the directory5View bars:
l Overview: This can be seen how to grab the performance analysis file, for example, the above example isLine-by-line,Wall Time(CPU instruction)Way of grabbingURLThe address, etc., will also have information such as the system configuration in this view and the current number of modules and methods.
l Threads Tree:Record the current method executed by each thread, and the performance of the method.
l Call Tree: Regardless of the thread, all the requested entries are presented as a piece of data, but the order of the presentation is sorted according to the execution time, not according to the code order.
l Plain List: Display a list of all non-kernel code methods, and display the execution time and number of calls of each method.
l Hot Spots: It will display all the methods of the code including the kernel code to the list in the order of execution time sorting, and record the execution time ratio and time of each method.
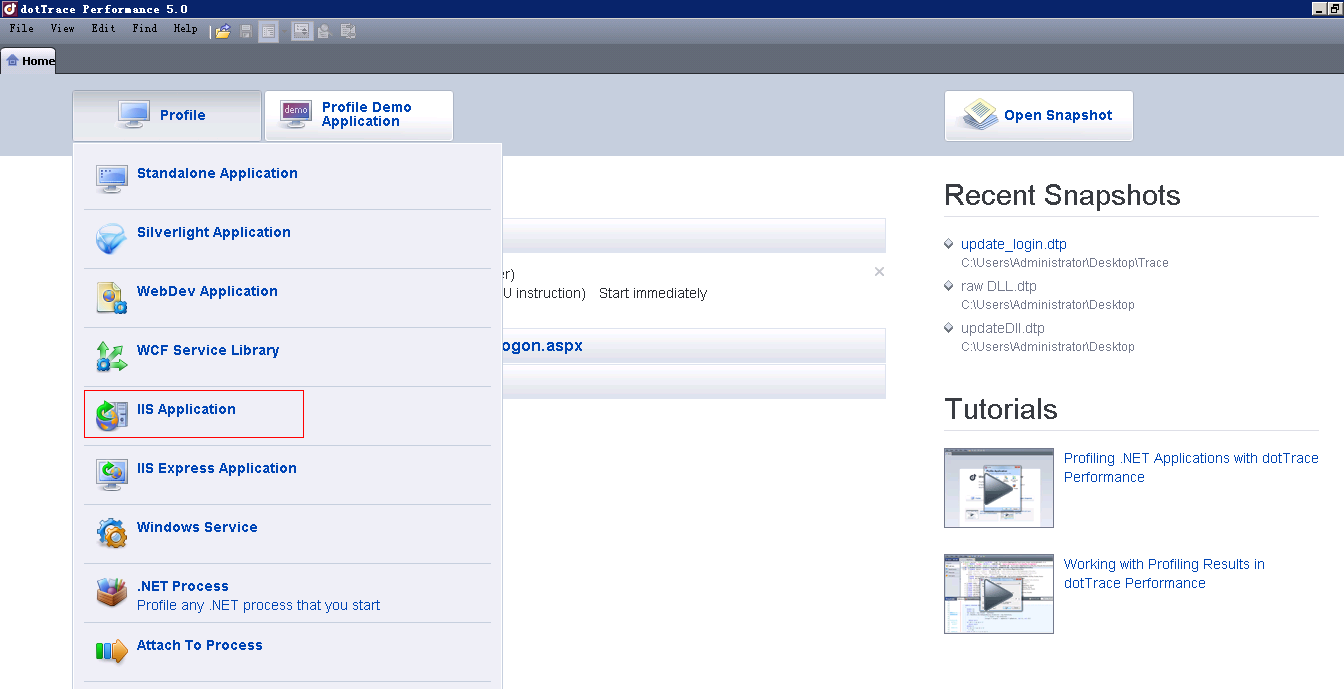
Perform performance analysis every time, in addition to selectionIISIn addition to the application and other methods, you also need to choose the way to grab. The general selection interface is as follows:
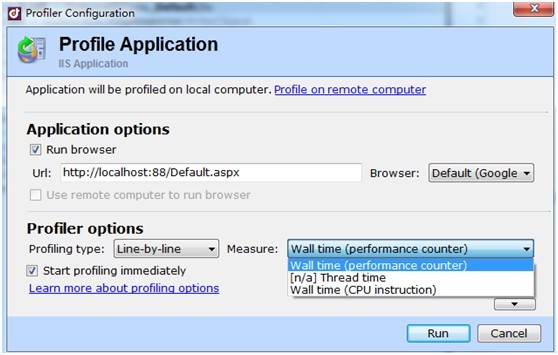
The above is to choose crawlIIS ApplicationThe selection interface after the program, the important ones are the followingProfiler optionsOptions.
profiling typeThere are three options:
l Tracing: It is obtained byCLRThe analysis time is calculated by the time difference between the start and end execution of a method.
l Line-by-line: It collects the time of each statement executed by the code, and the time it calculates is more accurate.
l Sampling: It is a sampling method, at intervals (windowsThe next is probably10ms), will suspend all threads, and grab the information in the stack, and then calculate the code execution time difference, this option may cause some short execution methods that cannot be caught.
MeasureThere are three options:
l Wall time(performance counter): It is throughPerformance Counter APITo collect information, the general operating system and various hardware devices provide performance countingAPIFor program calls.
l Thread time: It only supportsSamplingAnalysis method, it uses a fixed thread to grab the stack information to calculate the time, and it only calculates the time of its own internal program execution, regardless of waiting for otherIOtime.
l Wall time(CPU instruction): It is read byTSC processor registerThe method recorded in the entry and exit time difference is calculated.
According to the above options, generally we want to analyze the execution time of our program completely, it is recommended to useLine-byline(orTracing)withWall time(CPU instruction)orWall time(performance counter)Way, because if you use sampling andThread timeThe matching method will only calculate your own internal time, but not the time for your program to interact with external programs, which will make you mislead when analyzing performance.
Start analysisIISWhen the performance of the linked website is used, the use of toolsFile->Profile…Will causeIISApplication pool restartIt may take a long time, because the internal pre-compilation and operation of the database, for example, does not open the database connection pool, which will affect the results of the analysis and mislead yourself into thinking that the database or kernel code causes performance problems. Generally, it should be reused after the first performance analysisStart ProfilingWay to retest the website data, as shown in the figure:
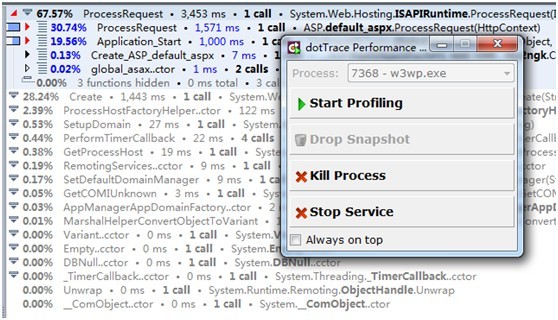
There will be a lot of kernel code and initialization operations inside that will affect the performance analysis, click here againStart ProfilingRe-perform performance analysis,It will not restart the application pool, As shown:

In this way, a lot of time-consuming operations for initialization are reduced, and the performance can be analyzed more accurately.
The above are some of my experiences after using it. Because there are very few introductions in Chinese, some refer to the introduction on the official website, and then through my own understanding, there will inevitably be something wrong. If you find any, please correct me, thank you!
Intelligent Recommendation
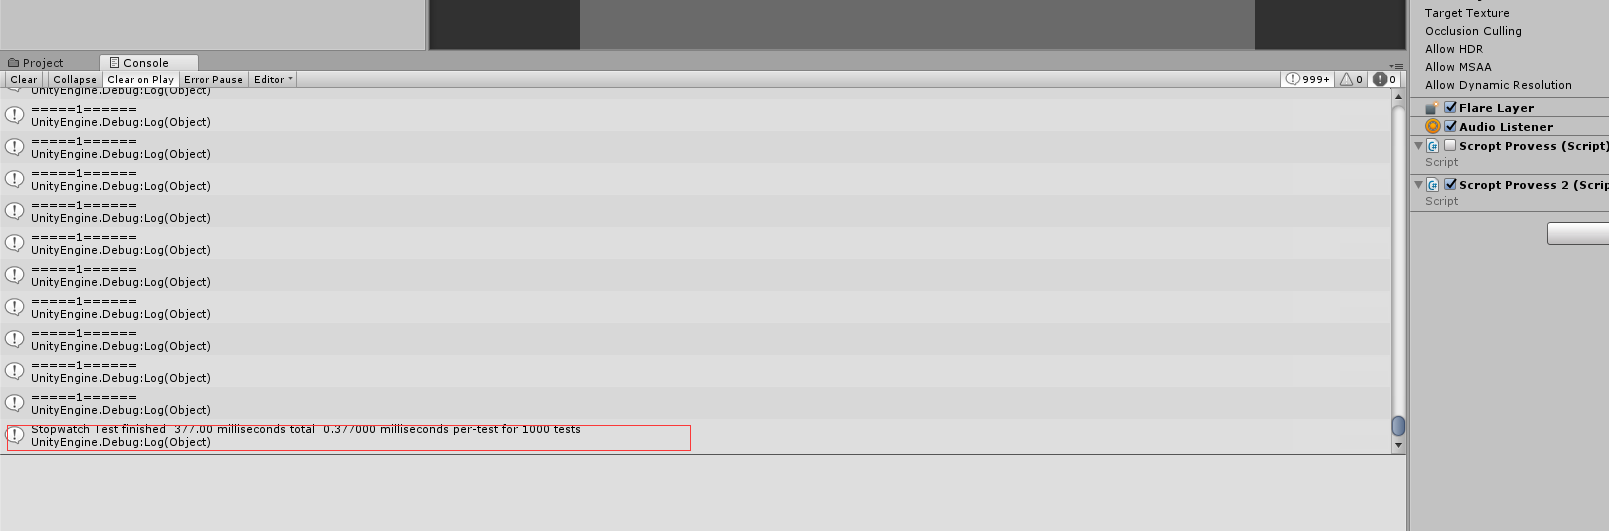
Performance analysis: Method of estimating CPU time consumption for code fragment execution 2: Custom timing and logging tools
Method 2: Realize the timing function through the Stopwatch object, and add the Log log to view the time consumed by the execution of this piece of code by looking at the Log log. The encapsulated tim...
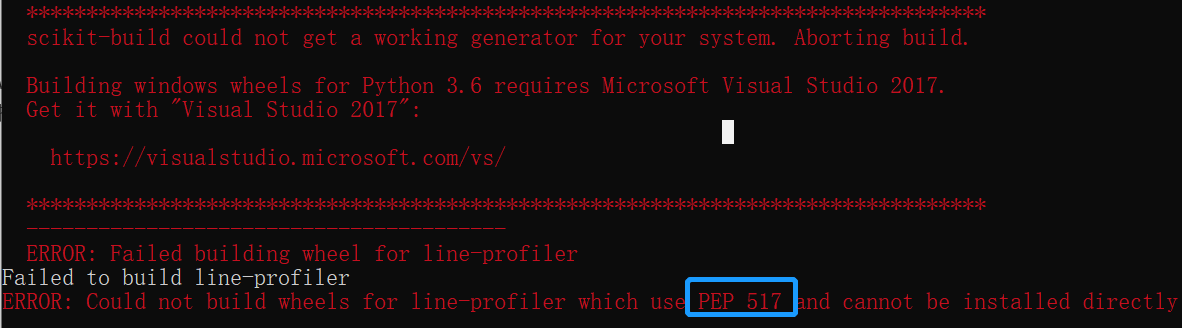
Python-19-Code Execution Time LINE_PROFILER Analysis
1 Install LINE_PROFILER Mainly in the Windows system, there will be some lack of environmental libraries. CMD>conda activate python36 CMD>pip install line_profiler https://www.lfd.uci.edu/~gohlk...
.net program call detection and performance analysis tool-DotTrace
DotTrace can monitor the performance of .net programs and monitor running programs and websites. The main interface is as follows: The tool needs to be installed on the server where the program is run...
Python code performance analysis tool (time + memory)
0 background When running a complex Python program, the execution time will be very long. At this time, you may want to improve the execution efficiency of the program. But what to do? First of all, t...
More Recommendation
Python Performance Analysis: Test Code Run Time
The Perf_Counter function in the TIME module is relatively accurate and contains the SLEEP time. ...

How to analyze a performance of a code: memory occupation, CPU occupation and execution time
Some tools are introduced from the following two aspects, Java, C / C ++, and Golang are involved. 1. CPU occupation and execution time There are two tools under Linux C / C ++. One is Perf, and it wi...
STOPWATCH example performance test - Test code execution time
2019 Unicorn Enterprise Heavy Glour Recruitment Python Engineer Standard >>> The first kind of Spring The second method (org.apache.commons.lang3.time.stopWatch): Third use method (Gua...

Instrument Time Profiler: CPU analysis tool analyzes code execution time
I used to remember to configure the corresponding dSYM before using the instrument. Otherwise, the Time Profiler will see the 26-bit address of the calling function. This is not convenient for us to f...
Track the execution of glibc code with GDB (GDB Classic-Performance Analysis)
https://www.cntofu.com/book/46/gdb/1811.md https://www.cntofu.com/book/46/linux_tools/sar.md https://www.cntofu.com/book/46/linux_tools/readelf.md https://www.cntofu.com/book/46/linux_tools/objdump.md...