D3.js : axis
Reference link:https://github.com/d3/d3/blob/master/API.md#axes-d3-axis
First, d3 can generate 4 kinds of axes, which are up, down, left, and right axis generators api, axisTop, axisButtom, axisLeft, axisRight
Here is just a simple way to record how to draw a scale on svg
<svg></svg>
The first step is of course to define a suitable scale, such as a linear scale.
let dataset = [12,45, 130]
let scaleLinear =
         d3.scaleLinear().domain([0, d3.max(dataset)]).range([0, 250]) // Linear
Then define an axis and choose any of the above as needed.
      / / Define an axis
      let xAxis = d3.axisRight()
Followed by the combination of the coordinate axis and the scale, using the method of the coordinate scale
xAxis.scale(scaleLinear)
Finally, put the axis into svg, use call, who wants to coordinate the axis who will call it
For example, put it directly into svg
Svg.call(xAxis) // can also be written as xAxis(svg)
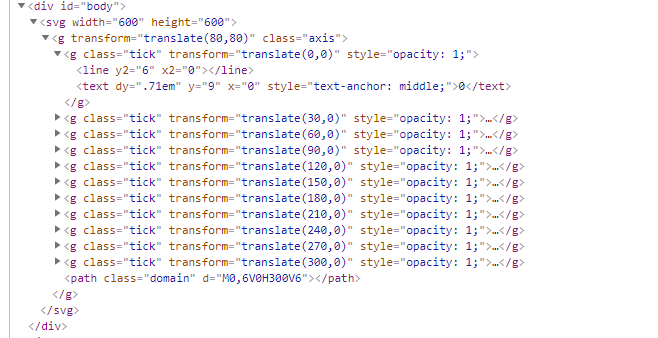
Or put in a group added by svg
      svg.append('g').attr('width', 320)
        .attr('height', 320)
        .attr('transform', 'translate(10, 10)').call(xAxis)
that's it
result

Intelligent Recommendation
Getting started with d3.js v4-axis
Prerequisite knowledge There are 7 shape elements in the svg canvas predefined elements. All the graphics on the canvas are composed of these 7 elements. Rectangle <rect> Round <circle> El...
D3.js Control SVG, Coordinate axis (02)
Foreword: This main content is SVG control. Use D3 to get, modify, delete nodes (primitives), scale, using D3 to draw simple column charts, introduce the coordinate axis. First, use D3 to query SVG 1....

D3.JS X-axis, Y-axis, title, etc. Text label
D3.JS X-axis, Y-axis, title, etc. Text label D3 text label, the tag is a Text content block, so we only need to add a Text to the SVG and then give this text position and specify content, and design a...
Drawing method of D3.js axis, adding scale of coordinate axis and axis of each scale (V3 version)
Axis (Axis) Axis axes (Axis) are visible in many charts, such as column charts, line charts, scatter charts, and more. A coordinate axis consists of a set of line segments and text, and the poi...
D3.js coordinate axis drawing method, adding coordinate axis scale and coordinate axis of each scale (V3 version)
D3.js coordinate axis drawing method, adding coordinate axis scale and coordinate axis of each scale (V3 version) Axis Axis can be seen in many charts, such as column chart, line chart, scatter...
More Recommendation
[D3.js-v5.x] (2) Drawing | Scale | Coordinate axis
Drawing: Take a bar chart as an example To draw, the first thing you need is a piece of drawing "canvas”。 HTML 5 provides two powerful "canvases":SVG with Canvas。 What is SVG SVG,...
D3.js v5 version of the introductory tutorial (Chapter 8)-axis
Introduction to the v5 version of D3.js (Chapter 8) There is no ready-made coordinate axis graphics in D3, we need to piece it together with other components. The coordinate a...
D3.js makes the two-dimensional coordinate axis basically introduced
D3.js makes the two-dimensional coordinate axis basically introduced Htmlstructure CSSstyle javascriptscript final result: analysis D3 is similar to jQuery, support chain operation. This example carri...
Data Visualization - D3.JS Getting Started (scale and coordinate axis)
Getting started with D3.js D3(Data-Driven Document): D3 advantage: Learn to learn D3.js: Learn the website of D3.JS: Section 2: Scale and coordinate axes Quantitative scale Number scale Axis Exercise:...
Use of the D3 axis
Method for dynamically changing coordinate axes based on different data First prepare the position of the coordinate axis, call again when calling the coordinate axis, you can dynamically update the c...