Mathematica drawing elliptical cycloid cluster (2)
tags: mathematica geometry
1. Elliptical integral
Elliptic integral is a general term for a type of integral, and here only the integral used to calculate the ellipse perimeter. This kind of integral cannot be expressed by basic functions, but can only be expressed in integral form. To calculate the perimeter of an ellipse using integrals, you have to use curve integrals. L is the circumference of the ellipse. Calculate the length of 90 degrees and multiply by 4.
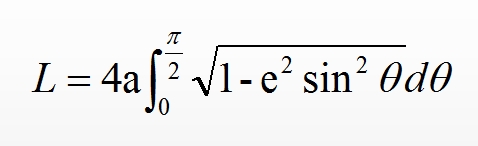
And in Mathenatica there is also elliptic integral EllipticE, where EllipticE[θ,m] can be used for any angle of elliptic arc length.
2. Elliptical cycloid cluster
Originally, the starting point was placed on the end point of the long axis, and then I thought I could put the starting point on the end point of the short axis.
It can be seen that the two types of cycloid are completely different, and then think about it, because the curve from each point on the circle is the same, and the ellipse is different, so the Each point on the 90 degree arc creates a cycloid, forming a cycloid cluster.


You can also modify the color, or the other half of the cycloid.

Increase the length of the scroll, but the computer conditions are not allowed, and the angle is relatively small.
Code above:
f[x_] := x - Quotient[x, 2 Pi]*2 Pi;
h[x_] := Piecewise[{{ArcTan[4 Tan[x]], f[x] <= 0.5 Pi},
    {ArcTan[4 Tan[x]] + Pi, 0.5 Pi < f[x] <= Pi},
    {ArcTan[4 Tan[x]] + Pi, Pi < f[x] <= 1.5 Pi},
    {ArcTan[4 Tan[x]] + 2 Pi, 1.5 Pi < f[x] <= 2 Pi}}];
a = Table[
  Show[{
    Plot[x^2, {x, 1, 3}, Axes -> True, AxesOrigin -> {0, 0},
     AspectRatio -> 1/4, PlotStyle -> {Thick, White},
     PlotRange -> {{-3, 24}, {-3, 5}}],
    Table[ParametricPlot[{2 EllipticE[t, 0.75] +
        Cos[0.5 Pi - h[t] + t]*2/Sqrt[3*Sin[t]^2 + 1] -
        2*Cos[0.5 Pi - h[t] - k]/Sqrt[3*Sin[k]^2 + 1],
       Sin[0.5 Pi - h[t] + t]*2/Sqrt[3*Sin[t]^2 + 1] -
        2 Sin[0.5 Pi - h[t] - k]/Sqrt[3*Sin[k]^2 + 1]}, {t, 0.0001,
       t}, PlotStyle -> ColorData["VisibleSpectrum"][400 + 130 k/1.5]],
     {k, 0.001, Pi, 0.05 Pi}],
    Graphics[
     Rotate[{Red, Thick,
       Circle[{2 EllipticE[t, 0.75] +
          Cos[0.5 Pi - h[t] + t]*2/Sqrt[3*Sin[t]^2 + 1],
         Sin[0.5 Pi - h[t] + t]*2/Sqrt[3*Sin[t]^2 + 1]},
        {1, 2}
        ], AxesStyle -> {Thick, Black, Black}},
      -h[t]]
     ]
    }], {t, 0.001, 4 Pi, 0.04 Pi}] (*plot coordinate axis is set in the front, graphic can be displayed together after the back *)
 Export["e:/Program Files/math files/Elliptical scroll 88.gif", a,
  ImageResolution -> 100];
Intelligent Recommendation
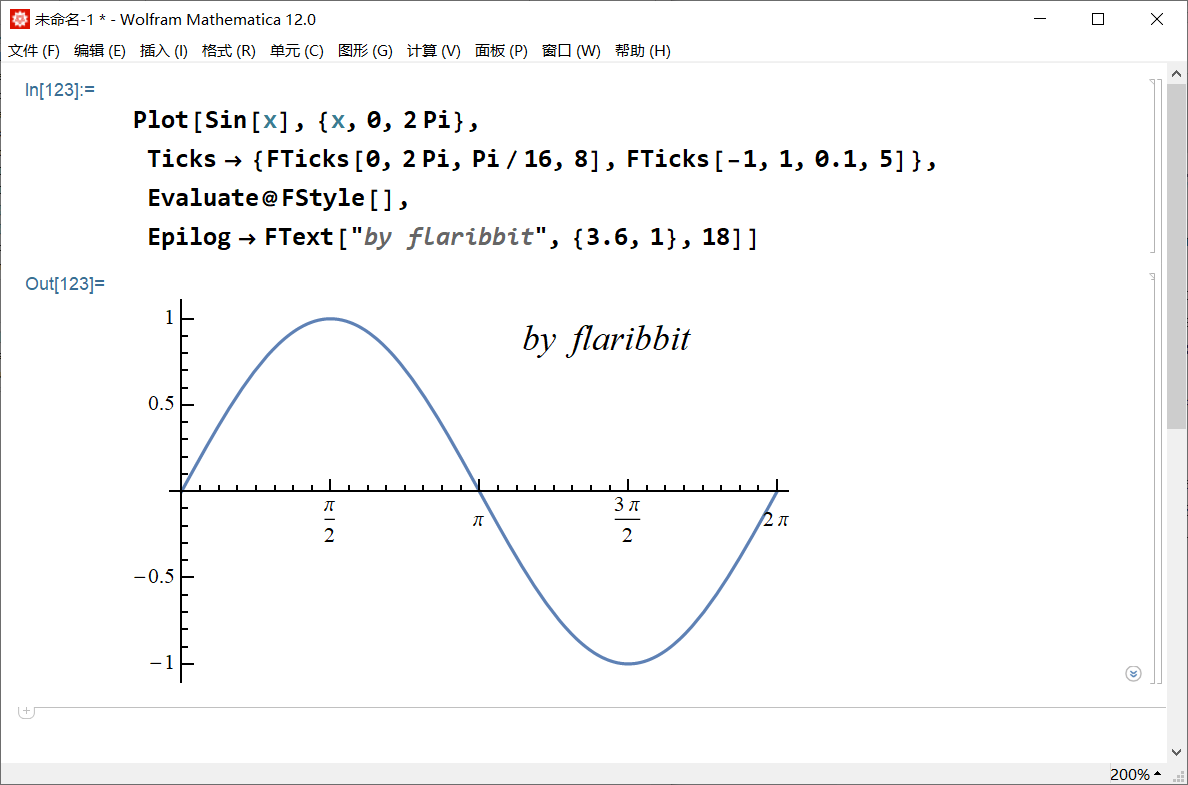
Several functions of Mathematica to beautify the drawing
See also the problem of drawing. In addition, it’s too tired to write scales and so on, so I just wrote a few functions. Examples of usage: Evaluate@FStyle[font size, font](Parameters can be omi...
Some small surprises in Mathematica drawing
Some small surprises in the drawing operation in Mathematica Listplot (Draw Points) GenerallyJoined (connection point) Use together to get a curve that will be connected to the plot, as follows: PlotM...

Mathematica (2) Help menu
(One)? command If we don't know the specific form of a command, you can use:? Name to view the contents of functions or variables; For example, we often encounter the HOLD [] function, then what is th...
To learn GDI + [4]: DrawEllipse - drawing an elliptical
Reproduced in: https: //www.cnblogs.com/keyvip/archive/2010/12/31/1922790.html...
The basic pattern of drawing an elliptical, circular arc
Draws an ellipse: and Graphics Pen object requires. Graphics object DrawEllipse method, Pen object store for presenting elliptical line properties, such as width and color. &nb...
More Recommendation
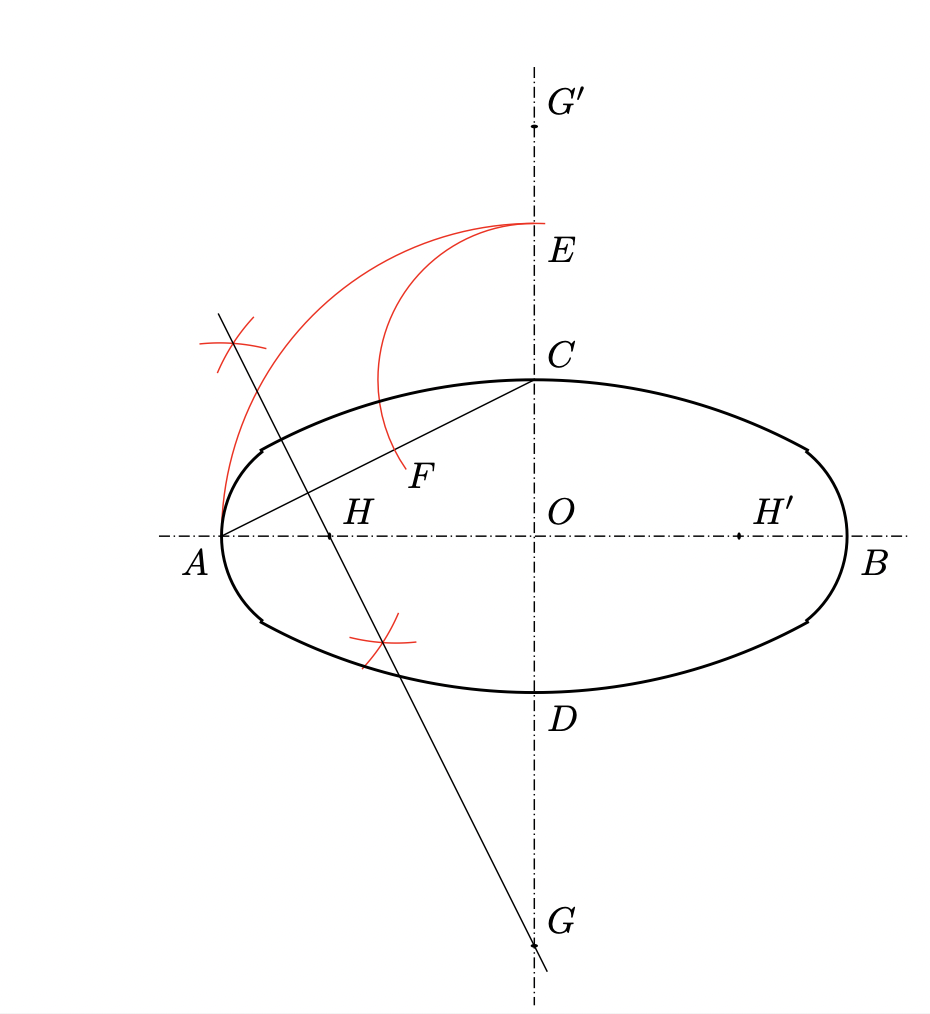
TIKZ Drawing Sample - Square Motation: Elliptical Approximation
practice Long axis A B AB ABShort axis C D CD CD, A B , C D AB,\,CD AB,CDDividerts with each other O O O; connection A C AC AC; In O O OFor the center, O A OA OAArc for radius O C OC OCExtens...

Using Mathematica drawing cissoid pattern (Cissoid of Diocles)
definition: Baidu Encyclopedia: "cissoid, sometimes called bis cissoid is a graph Diocle is found at 180 BC in geometry, cissoid is given from two curves C1, C2 and point O (the pole. ) generated...
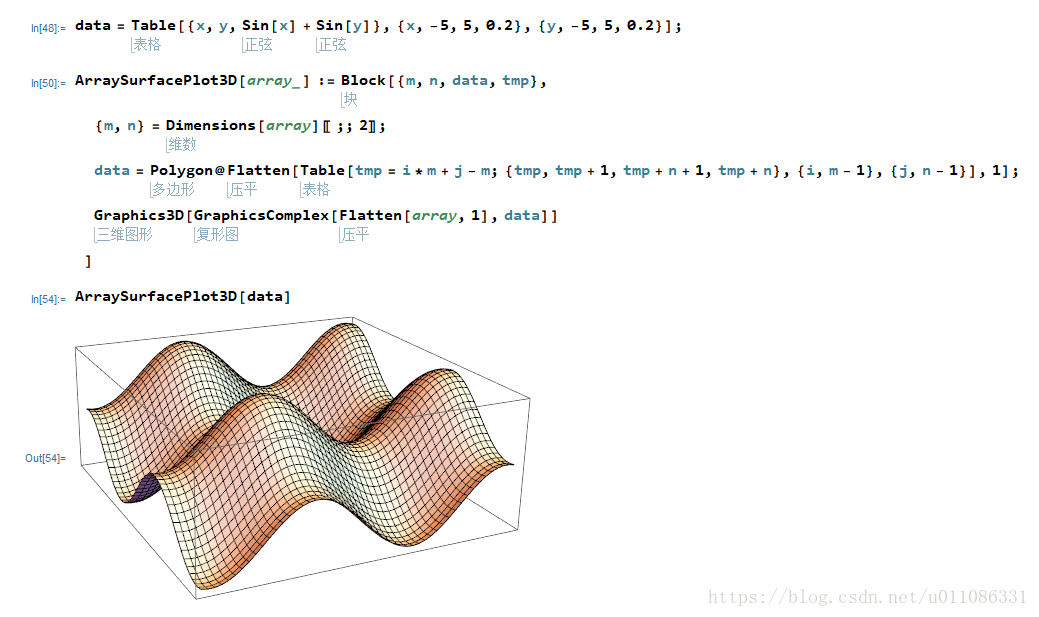
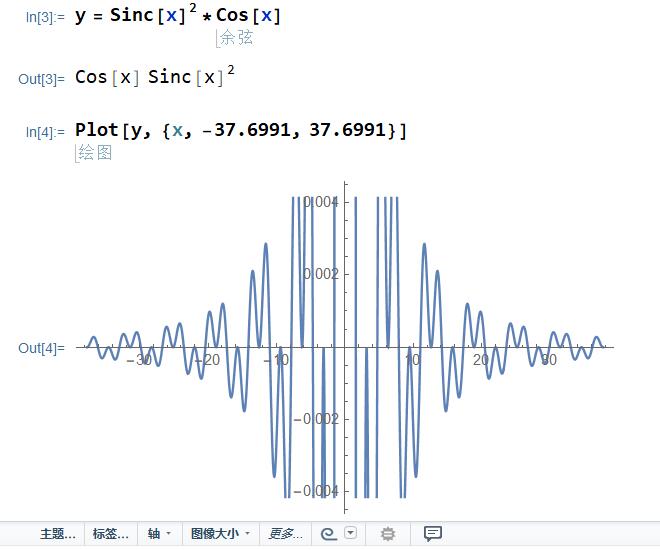
Application of Mathematica Software in the Drawing of Journal Papers (1)
I. Introduction As the first article in this series, I will mainly put some illustrations that I have drawn with Mathematica. Follow-up articles will introduce the Mathematica drawing methods of vario...
Mathematica drawing, how to adjust the size of the coordinate scale
I wanted to draw a picture from the beginning, but the ordinate scale of the displayed graph is too small, which makes it impossible to display all the pictures as follows: The reason is that I did no...