Python+OpenCV image processing "1. Drawing histograms and histogram equalization"
Directly on the code:
#!/usr/bin/env python
# -*- coding:utf-8 -*-
# Author: Hren
import cv2
import numpy as np
import matplotlib.pyplot as plt

image = cv2.imread('../image/0.jpg')     # Read in RGB image
rows,cols,_=image.shape
image = cv2.resize(image, (cols//4, rows//4))  # The original image is too large, resize to 1/16 of the original image
rows,cols,ch=image.shape
print('Row/height:',rows,'Column/Width:',cols,'aisle:',ch)
image = cv2.cvtColor(image, cv2.COLOR_RGB2GRAY)
cv2.imshow('image', image)

plt.subplot(1,2,1)
# The first method to draw a histogram according to the principle
hist = np.zeros(256)    # Grayscale histogram one-dimensional array
for i in range(rows):
    for j in range(cols):
        hist[image[i, j]] +=1   # The array position count corresponding to the gray value plus 1
plt.plot(hist, 'black')

# The second kind of Matplotlib draws histogram
plt.hist(image.ravel(), 256, [0, 256], color='r')

# Histogram equalization
G = image.copy()
p_hist = hist/(rows * cols)     # Calculate the gray distribution probability of the original image
p_add_hist = [0]*256            # Calculate the cumulative distribution probability of the original image gray scale
p_add = p_hist[0]
for i in range(1, len(hist)):
    p_add += p_hist[i]
    p_add_hist[i] = p_add
for i in range(rows):
    for j in range(cols):
        G[i, j] = p_add_hist[image[i, j]]*255   # Histogram equalized image
cv2.imshow('G', G)

plt.subplot(1,2,2)
# Matplotlib draws histogram
plt.hist(G.ravel(), 256, [0, 256], color='r')
plt.show()  # Two histograms are drawn on one picture

cv2.waitKey(0)
cv2.destroyAllWindows()
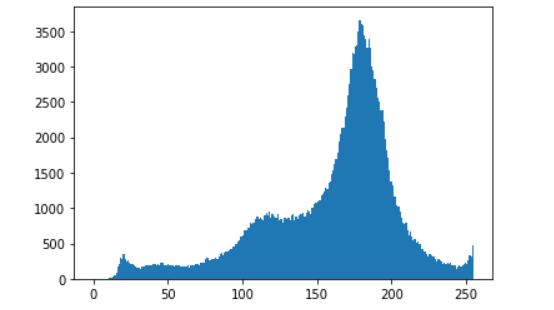
process result:
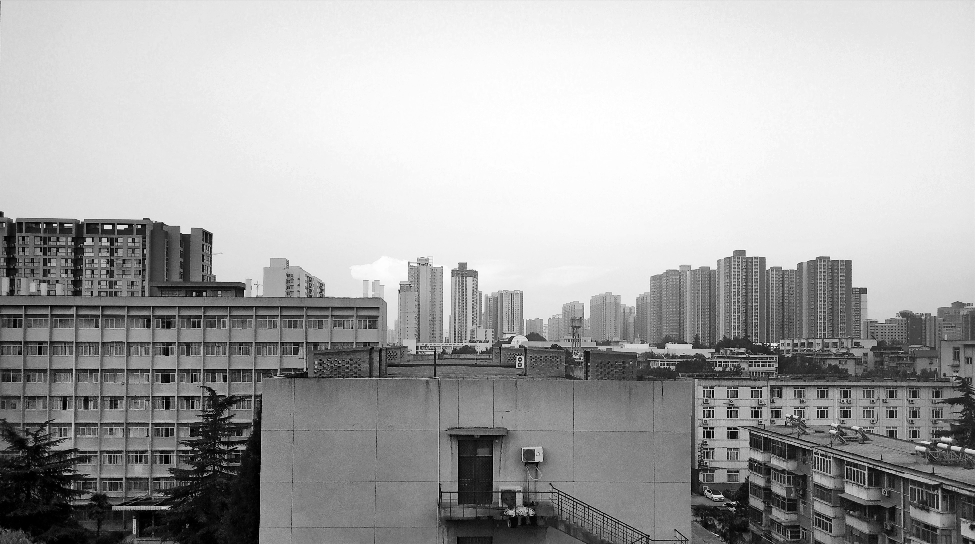

It can be seen that after the histogram equalization, the picture effect is much better than before, and the clouds in the distance become clearer.
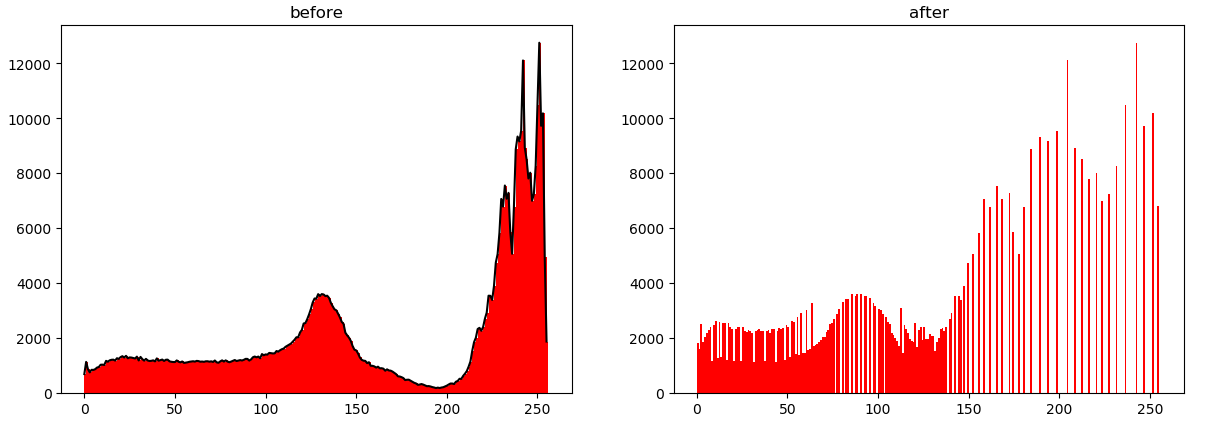
Comparison of histograms before and after equalization:
Threshold segmentation based on gray histogram:
In a sense, the reason why the gray value of the lowest valley (valley point) between two peaks is used as the threshold to determine the threshold segmentation is the most appropriate, because the histogram is the derivative of the area function. Near the bottom of the valley, the value of the histogram is relatively small, which means that the area function changes slowly with the threshold gray level. If we choose the gray value at the bottom of the valley as the threshold, we can minimize the impact on the object boundary.
According to the histogram before equalization, it can be seen that the gray value at the bottom of the valley is about 200. The threshold segmentation effect is as follows:

# Use histogram valley bottom gray value for threshold segmentation
threshold = image.copy()
for i in range(rows):
    for j in range(cols):
        if threshold[i, j] <= 200:
            threshold[i, j] = 0
        else:
            threshold[i, j] = 255
cv2.imshow('threshold', threshold)
cv2.imwrite('../csdn/threshold.png', threshold)
Intelligent Recommendation

python-opencv test Simple image processing to achieve image grayscale processing, histogram, Gaussian filtering and histogram equalization
One, use idle to test python-opencv Start the test from the simple, download the relevant photo processing toolkit through the study of the textbook, download and install PIL, PIL provides general ima...
openCV—Python(8)—— Image histogram and histogram equalization
One, function introduction 1. calcHist—calculate image histogram Function prototype: calcHist(images, channels, mask, histSize, ranges, hist=None, accumulate=None) images: image matrix, for exam...

Image processing (1) histogram equalization
In order to enhance the image contrast, it is usually necessary to adjust the gray level distribution of the image to make the brightness and darkness more distinct. If the probability of certain gray...

OpenCV-image processing (23, histogram equalization)
Image histogram The image histogram refers to the number of times the frequency of the entire image is counted in the grayscale range (0~255). The histogram generated according to this is called the i...
More Recommendation
Opencv image processing (nine) histogram equalization
reference:...

OpenCV - Histogram Equalization of Digital Image Processing
OpenCV - Histogram Equalization of Digital Image Processing Starting from this blog post, Xiaosheng officially switched to digital image processing from an unrelated professional. Not much nonsense, t...

[OpenCV image processing] 1.23 Histogram equalization
Article Directory Related theories Code & display effect Related theories What is a histogram? Image histogram refers toCount the frequency of occurrence of the pixel value (0~255) of the entire i...
OpenCV-histogram drawing and histogram equalization
OpenCV-histogram drawing and histogram equalization 1. Histogram equalization function: hist = cv.calcHist( images, channels, mask, histSize, ranges[, hist[, accumulate]] ) images: The image format of...