D3 coordinate axis
Chapter 7 Coordinate axis
The coordinate axis is a graphic that often appears in the visualization chart, consists of some column segments and scale. The coordinate axis is not a ready-made graphic element in the SVG, and it needs to be composed of other elements. D3 provides components of the coordinate axis, so that the coordinate axis is drawn in the SVG canvas is as simple as adding a normal element.

What make up from the coordinate axis
There are six basic graphics in the predefined elements of the SVG canvas:
- rectangle
- Circular
- oval
- Line segment
- Fold line
- Polygon
In addition, there is a relatively special, and the strongest element of functionality:
- path
All graphs in the canvas are composed of more than seven elements.
Obviously, this is notAxis This element is. If so, we can use the following way to define:
<axis x1="" x2="" ...></axis>Unfortunately, there is no such element. However, this design is reasonable: it is impossible for each graphic to equip a separate element, so SVG will be too large.
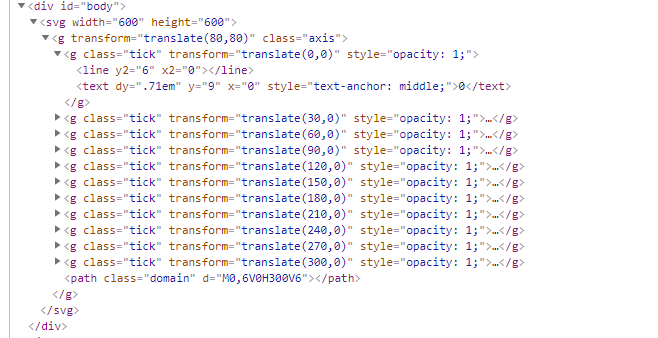
Therefore, we need to use other elements to combine the coordinate axis, and eventually make it similar to the following form:
<g>
<! - The first scale ->
<g>
 <line> </ line> <! - The first scale of the first scale ->
 <text> </ text> <! - The first mark of the scale ->
</g>
 <! - Second Scale ->
<g>
 <line> </ line> <! - The second scale of the straight line ->
 <Text> </ text> <! - The second scale ->
</g>
...
 <! - axis of the coordinate axis ->
<path></path>
</g>
Packet elements, is the element in the SVG canvas, meaning group. This element is a container that combines other elements, where is used to store other elements of the coordinate axis.
If you need to manually add these elements, it is too much trouble, for this, D3 provides a component: D3.svg.axis (). It has completed the above work for us.
Define the coordinate axis
The last chapter refers to the concept of scale, to generate a coordinate axis, need to use the scale, which is often used together. Below, on the basis of the data and scale of the previous chapter, the components of a coordinate axis are added.
// data
var dataset = [ 2.5 , 2.1 , 1.7 , 1.3 , 0.9 ];
 // Define the scale
var linear = d3.scale.linear()
      .domain([0, d3.max(dataset)])
      .range([0, 250]);

var axis = d3.svg.axis()
           .scale (linear) / / Specify scale
           .orient ("bottom") // Specify the direction of the scale
           .ticks (7); // Specify the amount of scale
No. 1 - 2 lines: Define an array.
No. 4 - 7 lines: Define the scale, which uses array dataset.
No. 9 - 12 lines: Define the coordinate axis, which uses linear scale LINEAR. among them:
- D3.Svg.Axis (): The components of the coordinate axis in D3 can generate an element constituting the coordinate axis in the SVG.
- Scale (): Specifies the scale.
- Orient (): Specify the header of the scale, Bottom is displayed below the coordinate axis.
- Ticks (): Specifies the number of minutes.
Add a coordinate axis in SVG
After defining the axis, you only need to add a packet element in the SVG, and then add other elements of the coordinate axis to this. code show as below:
svg.append("g")
   .call(axis);
has onecall()Function, its parameters are the front-defined axis AXIS.
In D3, the parameter of the call () is a function. After calling, the current selection set is passed to this function. That is, the following two codes are equal.
function foo(selection) {
  selection
      .attr("name1", "value1")
      .attr("name2", "value2");
}
foo(d3.selectAll("div"))
and
d3.selectAll("div").call(foo);therefore,
svg.append("g").call(axis);
axis(svg.append(g));Set the style and location of the coordinate axis
The default axis style is not beautiful, and a common style is provided below:
<style>
.axis path,
.axis line{
    fill: none;
    stroke: black;
    shape-rendering: crispEdges;
}

.axis text {
    font-family: sans-serif;
    font-size: 11px;
}
</style>
defines the style of PATH, LINE, TEXT elements under class Axis, respectively. Next, you only need to set the class of the coordinate axis to AXIS.
The position of the coordinate axis can be set by the Transform property.
Typically, when adding an element, it is set to write as follows:
svg.append("g")
  .attr("class","axis")
  .attr("transform","translate(20,130)")
  .call(axis);
Source code
Download address:<a rel="nofollow" href="http://www.ourd3js.com/demo/rm/R-5.0/Axis.html" "="" style="box-sizing: border-box; background-color: transparent; color: rgb(45, 133, 202); text-decoration-line: none;">http://www.ourd3js.com/demo/rm/R-5.0/Axis.html
Intelligent Recommendation
D3.js makes the two-dimensional coordinate axis basically introduced
D3.js makes the two-dimensional coordinate axis basically introduced Htmlstructure CSSstyle javascriptscript final result: analysis D3 is similar to jQuery, support chain operation. This example carri...
D3 learning pointing north - Chapter 4, scale and coordinate axis
D3 learning pointing north - Chapter 4, scale and coordinate axis 1 Introduction Although we painted a column chart in the last section, there are still many places to be improved. The most important ...
Data Visualization - D3.JS Getting Started (scale and coordinate axis)
Getting started with D3.js D3(Data-Driven Document): D3 advantage: Learn to learn D3.js: Learn the website of D3.JS: Section 2: Scale and coordinate axes Quantitative scale Number scale Axis Exercise:...
Drawing method of D3.js axis, adding scale of coordinate axis and axis of each scale (V3 version)
Axis (Axis) Axis axes (Axis) are visible in many charts, such as column charts, line charts, scatter charts, and more. A coordinate axis consists of a set of line segments and text, and the poi...
d3 axis
1, the drawing axis Drawing svg Draw horizontal axis Draw ordinate 2, the axes of the other parameters (Custom axis) 3, the axis unit 4, the rendering grid lines...
More Recommendation
V3 version of D3.js-used in Vue framework (Chapter 3) --- Scale bar and coordinate axis
1. Scale Four commonly used scales are recorded here: linear, ordinal, ordinal segment, time scale, others will be updated later or viewed on their official website d3.scaleLinear() d3.scaleOrdinal() ...
Use of the D3 axis
Method for dynamically changing coordinate axes based on different data First prepare the position of the coordinate axis, call again when calling the coordinate axis, you can dynamically update the c...

D3.js : axis
Reference link:https://github.com/d3/d3/blob/master/API.md#axes-d3-axis First, d3 can generate 4 kinds of axes, which are up, down, left, and right axis generators api, axisTop, axisButtom, axisLeft, ...
d3 scale axis
Axis common method method format Explanation axisTop d3.axisTop() Scale value generated in the scale above axisBottom d3.axisBottom() Generating a scale value of the scale at the bottom axisLeft d3.ax...
D3-- scale, axis
When the array is too large or too small dimensions selected Linear scale A linear scale, a continuous range can be mapped to another section. To solve the problem of the width of a column chart, you ...