TOP command parameter detailed
tags: Linux
Introduction
The TOP command is a performance analysis tool for Linux, which is capable of displaying resource occupancy status of each process in the system in real time, similar to Windows Task Manager.
TOP Displays the current process and other conditions, is a dynamic display process, which can be constantly refreshing the current state through the user button. If the command is executed at the front desk, it will exclusively, until the user terminates the program. It is more accurate The TOP command provides real-time monitoring of the system processor. It will display the most "sensitive" task list in the system. This command can be used by CPU. Memory usage and execution time sort the task; and this command Many features can be set by interactive commands or in personal custom files.
Parameter meaning
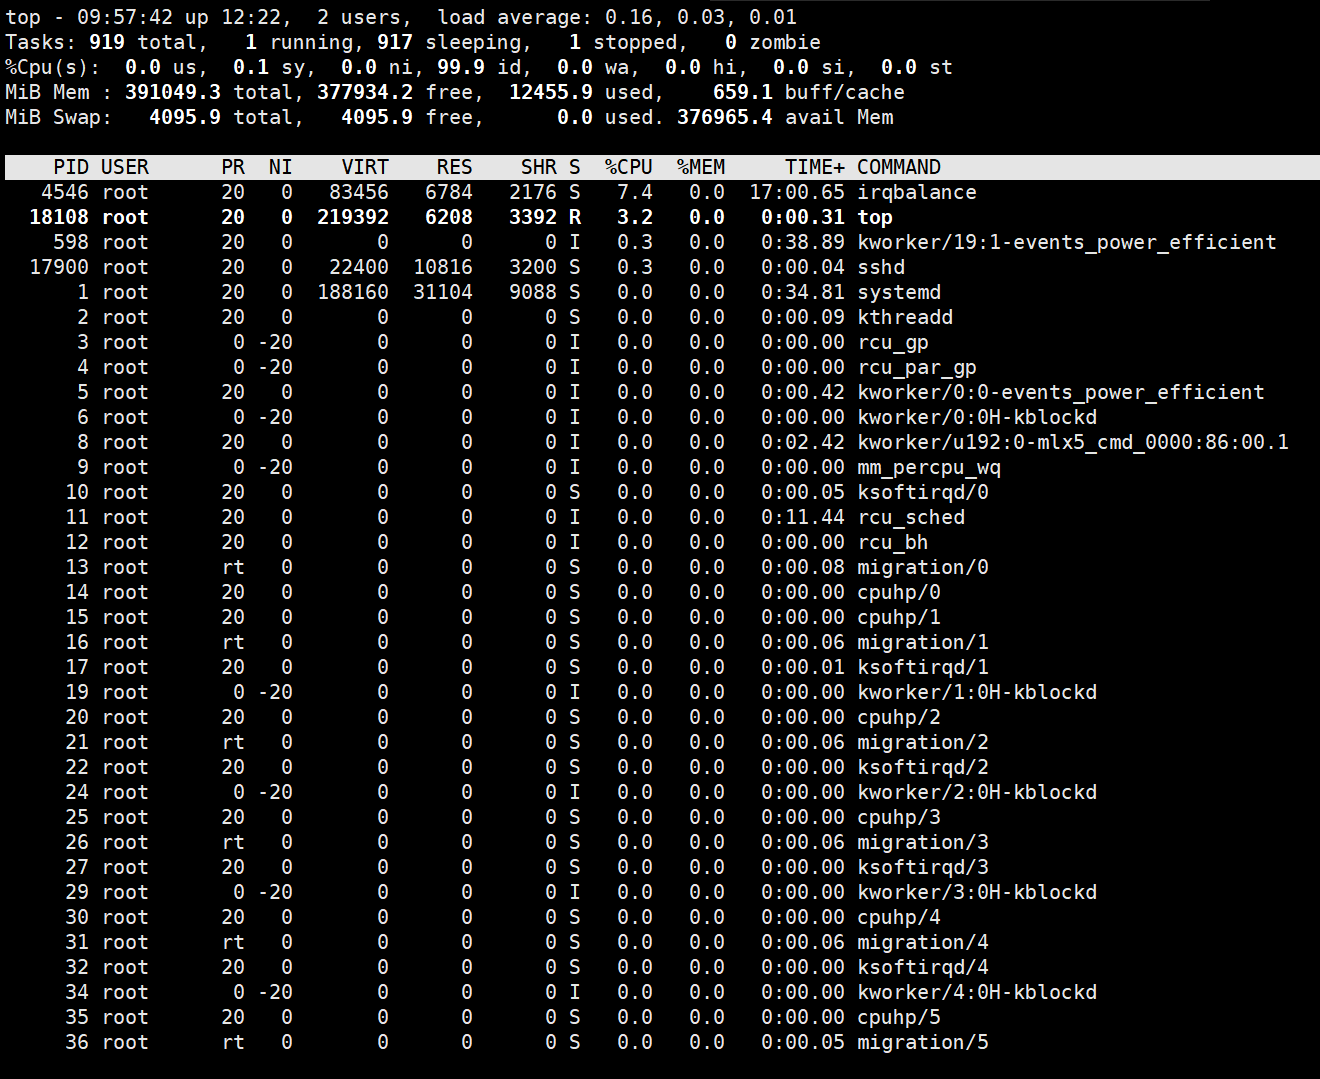
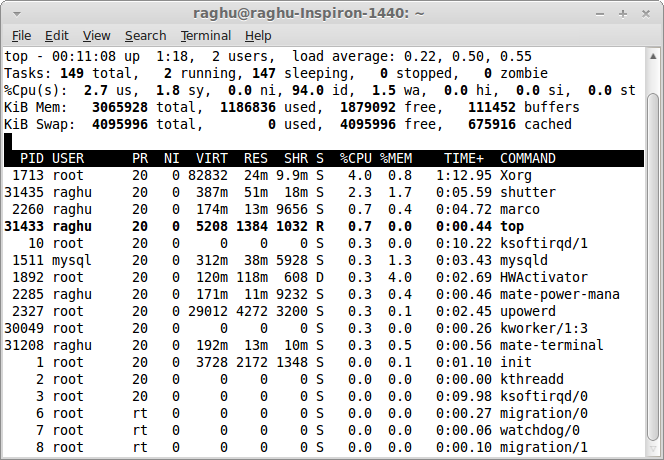
The top five lines of the statistics area are the overall statistics of the system. The first line is the task queue information, the execution result of the uPtime command. The content is as follows:
01:06:48 Current time
Up 1:22 system running time, format is:
1 User current login number of users
Load average: 0.06, 0.60, 0.48 system load, the average length of the task queue. The three values were 1 minute, 5 minutes, and 15 minutes before the average.
Second, three behavior processes and CPU information. These contents may exceed two rows when there are multiple CPUs. The content is as follows:
third,
Total total Total process
Running the number of processes running
Sleeping Sleep Process
Number of processes stopped in Stopped
Zombie Zombie Process
Cpu(s):
0.3% US user space occupies CPU percentage
1.0% SY kernel space occupies CPU percentage
0.0% Ni user process space changed the priority process occupied CPU percentage
98.7% ID free CPU percentage
0.0% WA waited for the input and output CPU time percentage
0.0% HI: Hardware CPU interrupt occupation percentage
0.0% Si: Soft Interrupt Occupation Percentage
0.0% ST: Percentage of virtual machine occupation
The last two behaviors are memory information. The content is as follows:
Mem:
191272k Total physical memory total
173656k USEDs used the total amount of physical memory
17616k Free idle memory total
22052k buffers used as the amount of memory for kernel cache
Swap:
192772k Total exchange area total
Total exchange area used by 0K USED
192772k free free exchange area total
The 123988k Cached buffered swap area, the content in the memory is swapped out, and then inserted into memory, but the used switching area has not yet been overwritten, which is in memory for these contents. The size of the switching area can no longer have to write to the switching area when the corresponding memory is replaced again.
Details of each process is displayed below the statistical information area of the process information area. First come to know the meaning of each column.
Serial number list meaning
A PID process ID
b PPID Parent Process ID
c RUSER Real user name
D UID Process Owner's User ID
E User process owner's username
F Group Process Opener Group Name
g TTY launched the terminal name of the process. Not the process started from the terminal display?
H PR priority
I ni nice value. Negative value represents high priority, positive value indicates low priority
J P last used CPU, meaning only in multi-CPU
K% CPU last updated to the current CPU time occupation percentage
l Time Time for the Time Process, Unit Seconds
M time + process Total CPU time, unit 1/100 seconds
N% MEM process used by physical memory percentage
o Virt process Total virtual memory used, unit KB. Virt = swap + res
In the virtual memory used by the P SWAP process, the size, unit KB.
The Q res process uses, the physical memory size, the unit KB. Res = Code + Data
R C code can perform the physical memory size of the code, unit KB
S Data can perform a physical memory size other than the section (data segment + stack), unit KB
T SHR shared memory size, unit KB
U NFLT page error
V NDRT last writes the number of pages that are modified now.
W S process status (D = uninterrupted sleep state, r = operation, s = sleep, t = track / stop, z = zombie process)
x command command name / command line
Y WCHAN If the process is sleeping, the system function name in the sleep is displayed.
Z flags task logo, refer to Sched.h
By default, only important PIDs, User, PR, Ni, Virt, Res, SHR, S,% CPU,% MEM, TIME +, and Comm, CPU, VIRT, RES, TIME +, and COMMAND columns are displayed. You can change the display content by the following shortcuts.
Changing the display content You can select the displayed content via the F key. Press the F button to display the list of columns, press A-Z to display or hide the corresponding column, and finally press the Enter key to determine.
Press the O key to change the order of the column. Pressing the a-z of a lower-written A-z to move the corresponding column, and the uppercase A-Z can move the corresponding column. Finally, press Enter key to determine.
According to the upper-written F or O key, press A-Z to sort the process according to the corresponding column. The upper-written R key can reverse the current sorting.
Command use
Top usage format
top [-] [d] [p] [q] [c] [C] [S] [s] [n]
Parameter Description
D Specifies the time interval between each two screen information refreshes. Of course, users can change them with S interacting commands.
P Monitor a certain process by specifying the monitoring process ID.
Q This option will make TOP not refreshed any delay. If the calling program has superuser privileges, TOP will run as high priority as possible.
S specified cumulative mode
s Run the TOP command in the security mode. This will remove the potential danger of interactive commands.
i makes TOP do not display any idle or zombie process.
c shows the entire command line, not just display the command name
Other utility orders
The following describes some interactive commands that can be used during the execution of the TOP command. From a perspective of use, skilled mastery of these commands is more important than the master option. These commands are single-letters, and if the S option is used in the command line option, some of these commands will be blocked.
Ctrl + L erases and overrides the screen.
h or? Display the Help screen to give some short command summary instructions.
k Terminates a process. The system will prompt the user to enter the process PID that needs to be terminated, and what kind of signal that needs to be sent to the process. The general termination process can use 15 signals; if the signal 9 is not allowed to end the process using signal 9. The default is the signal 15. This command is blocked in the security mode.
i ignore the idle and zombie process. This is a switching command.
Q Exit the program.
r rearranges a priority of a process. The system prompts the user to enter the process PID that needs to be changed and the process priority value that needs to be set. Enter a positive value will reduce the priority, and vice versa, you can have higher priority. The default is 10.
S Switch to the cumulative mode.
s changes the delay between two refreshes. The system will prompt the user to enter a new time, and the unit is s. If there is a decimal, it is converted to M s. Input 0 value, the system will continue to refresh, the default value is 5 s. It should be noted that if the setting is too small, it is most likely to be constantly refreshing, so that it is not as clear as shown in the display, and the system load will greatly increase.
f or f add or delete items from the current display.
o or o changes the order of displaying items.
l Switch to display average load and start time information.
m Switch to display memory information.
T Switch Display Process and CPU Status Information.
c Switch Display Command Name and Complete Command Line.
M Sort by the residential memory size.
P Sort by using the percentage size of the CPU.
T Sort by time / cumulative time.
W Write the current settings in the ~ / .toprc file. This is a recommended method for writing TOP profiles.
Operation:
Top // Explicit all proximity of all processes every 5 seconds
TOP -D 2 // Explicit all proximit of all processes every 2 seconds
Top -c // The resources of the explicit process are occupied every 5 seconds, and the command line parameters of the process (the default only process name)
TOP -P 12345 -P 6789 / / The PID is 12345 and PID is the resource occupancy of the two processes of 6789.
Top -d 2 -c -p 123456 // The PID is displayed every 2 seconds to the resource usage of the process of 12345, and the command line parameters that explicitly starts.
Intelligent Recommendation

Linux: top command detailed
First line: 10:01:23 — current system time 126 days, 14:29 — The system has been running for 126 days, 14 hours and 29 minutes (no reboot during this period) 2 users — There are curr...
Top command detailed debugging
Top command detailed debugging 1, top command introduction Top is a tool for dynamically viewing the current system load in Linux. It can view the memory, cpu, running time, load, etc. of the current ...

Ps, top command detailed
Ps: command is used to display the status of the current process (process) grammar: parameter: Use example: Example 1: View information using ps command: ps output: Description: The result will displa...
Detailed TOP command [turn]
The top command in Linux shows the processes that are running on the system. It is one of the most important tools for system administrators. It is widely used to monitor the load of servers. I...

Detailed linux-top command
1, top command usage The top command is often used to monitor the system status of Linux. It is a commonly used performance analysis tool that can display the resource usage of each process in the sys...
More Recommendation
Detailed content in the top command
Tips:freecommand topDetailed contents of the command: In the above output environment: The first line Interpretation: 21:03:22 # The current time system up 13 min When the system has been running long...

Linux in the top command Detailed
top: command provides real-time status monitoring system processor it will show the system CPU the most "sensitive" task list. This command can be used in CPU memory usage and execution time...
Linux-top command Detailed
The top command is probably the most intuitive, easy to use command to view the server load. It is real-time dynamic refresh the display server status information, and can customize the display of con...

Linux top command Detailed
top command is used to dynamically monitor process activity and system load, the format for the top FIG top running interface: The results of the first five overall behavior of the system statistics, ...

Linux's top command Detailed
Top command is often used to monitor Linux system conditions, such as cup, memory usage. · The f...