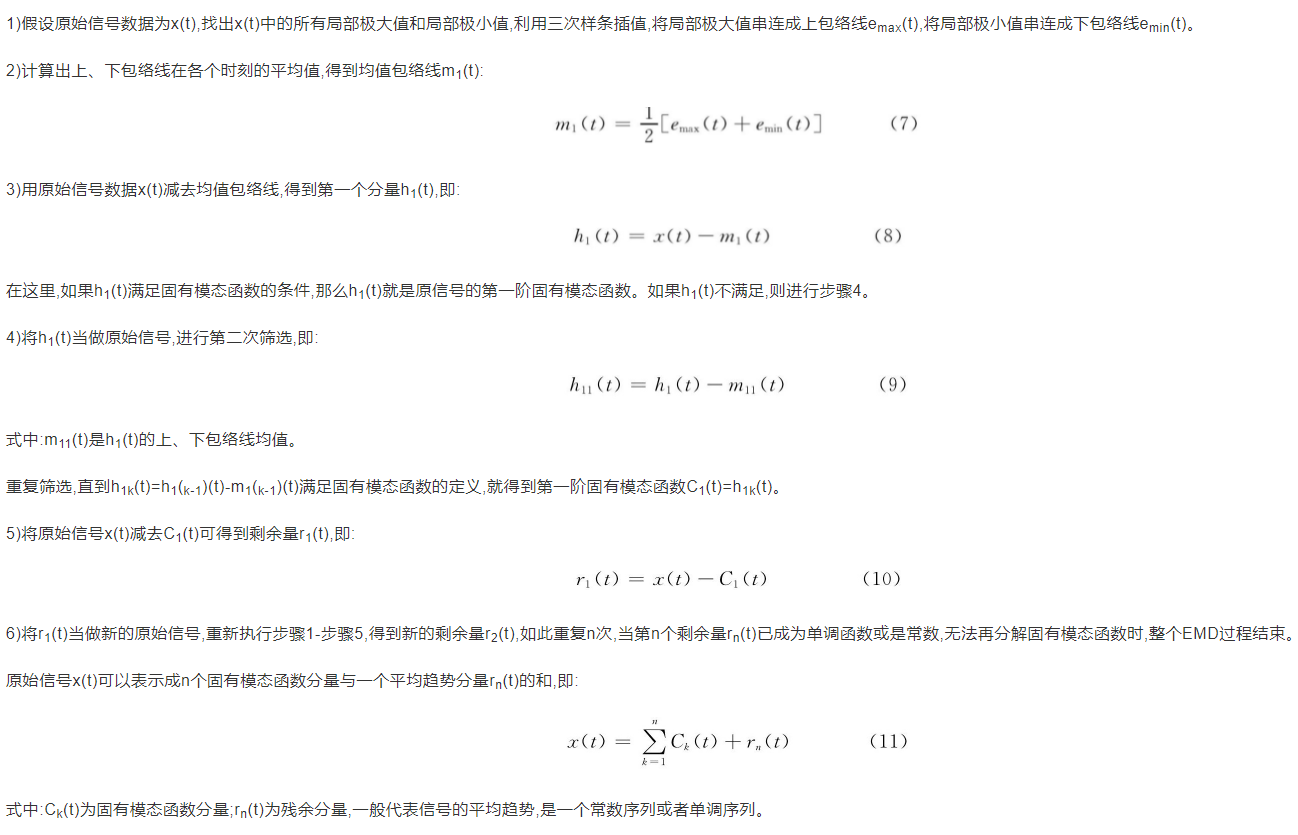
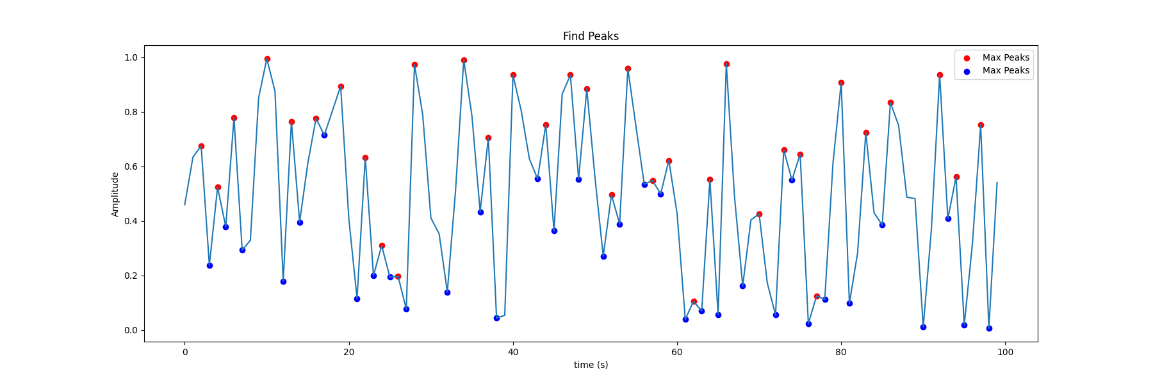
EMD (Empirical Mode Decomposition) Algorithm Three
tags: EMD Research notes
Last time I got the R language to do emd on the value of one column and then output the combined graph of all imf. Next, I will try to process multiple columns of values.
#Draw the last IMF with the highest value in all provinces
# Read data
load <- data.frame(read.csv("Max.csv"))
# Take the logarithm length(load) load[,2:length(load)] <- log(load[,2:length(load)]) The title of the final table
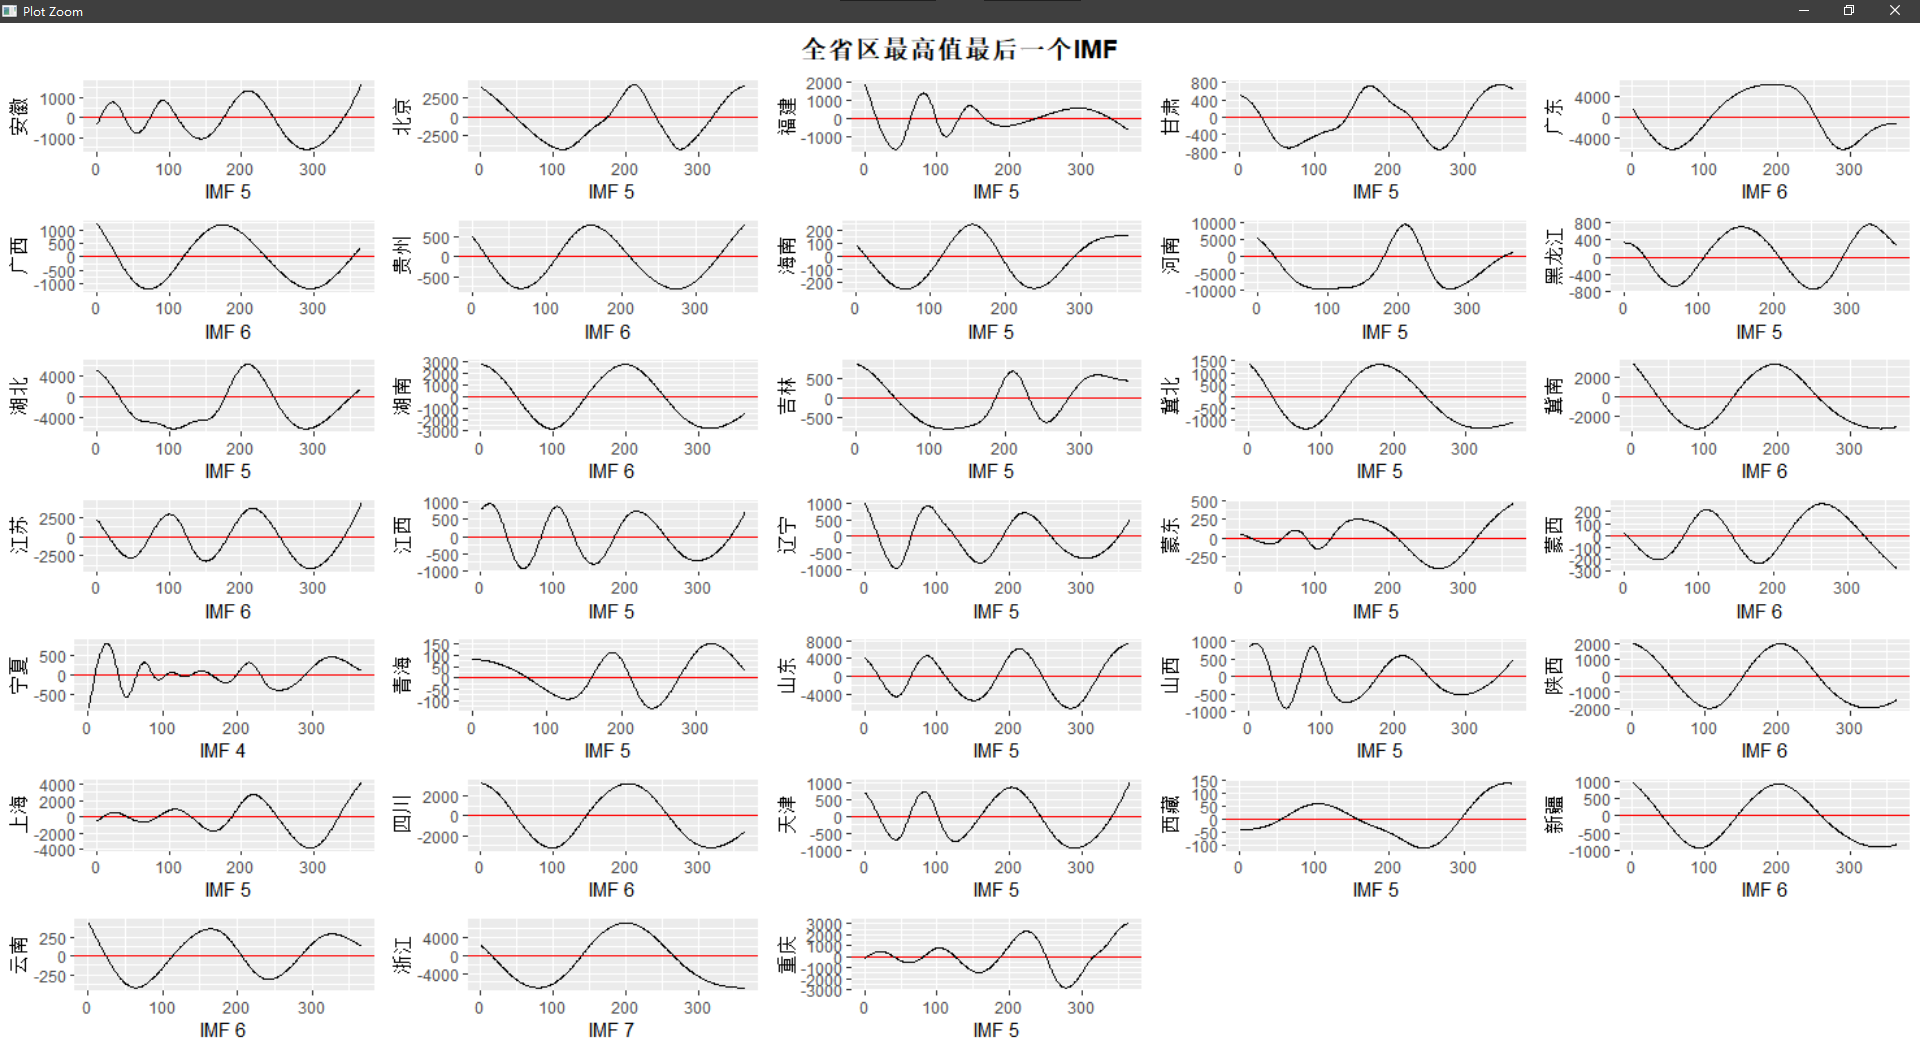
title <- "The last IMF with the highest value in the province"
# emd loop Create a list for storing charts
plotlist <- list()
for (i in 2:length(load)) {
# emd calculation
emd <- emd(xt = load[, i], boundary = "wave", stoprule = "type5")
# Choose to draw IMF and save! ! ! Choose which curve to draw here
emdframe <- data.frame(Time = load[, "date"], EMD = emd$imf[, emd$nimf])
plotlist[[i - 1]] <- ggplot(data = emdframe, aes(x = Time, y = EMD)) + geom_hline(yintercept = 0, colour = "red") + geom_line(size = 0.5) + labs(x = paste("IMF", emd$nimf), y = colnames(load[i]))
}
# Draw a combination chart
totalplot <- cowplot::plot_grid(plotlist = plotlist, ncol = floor(sqrt(length(load) - 1)))
# now add the title
titleplot <- ggdraw() + draw_label(title, fontface = "bold")
finalplot <- plot_grid(titleplot, totalplot, ncol = 1, rel_heights = c(0.05, 1)) # rel_heights values control title margins
finalplot
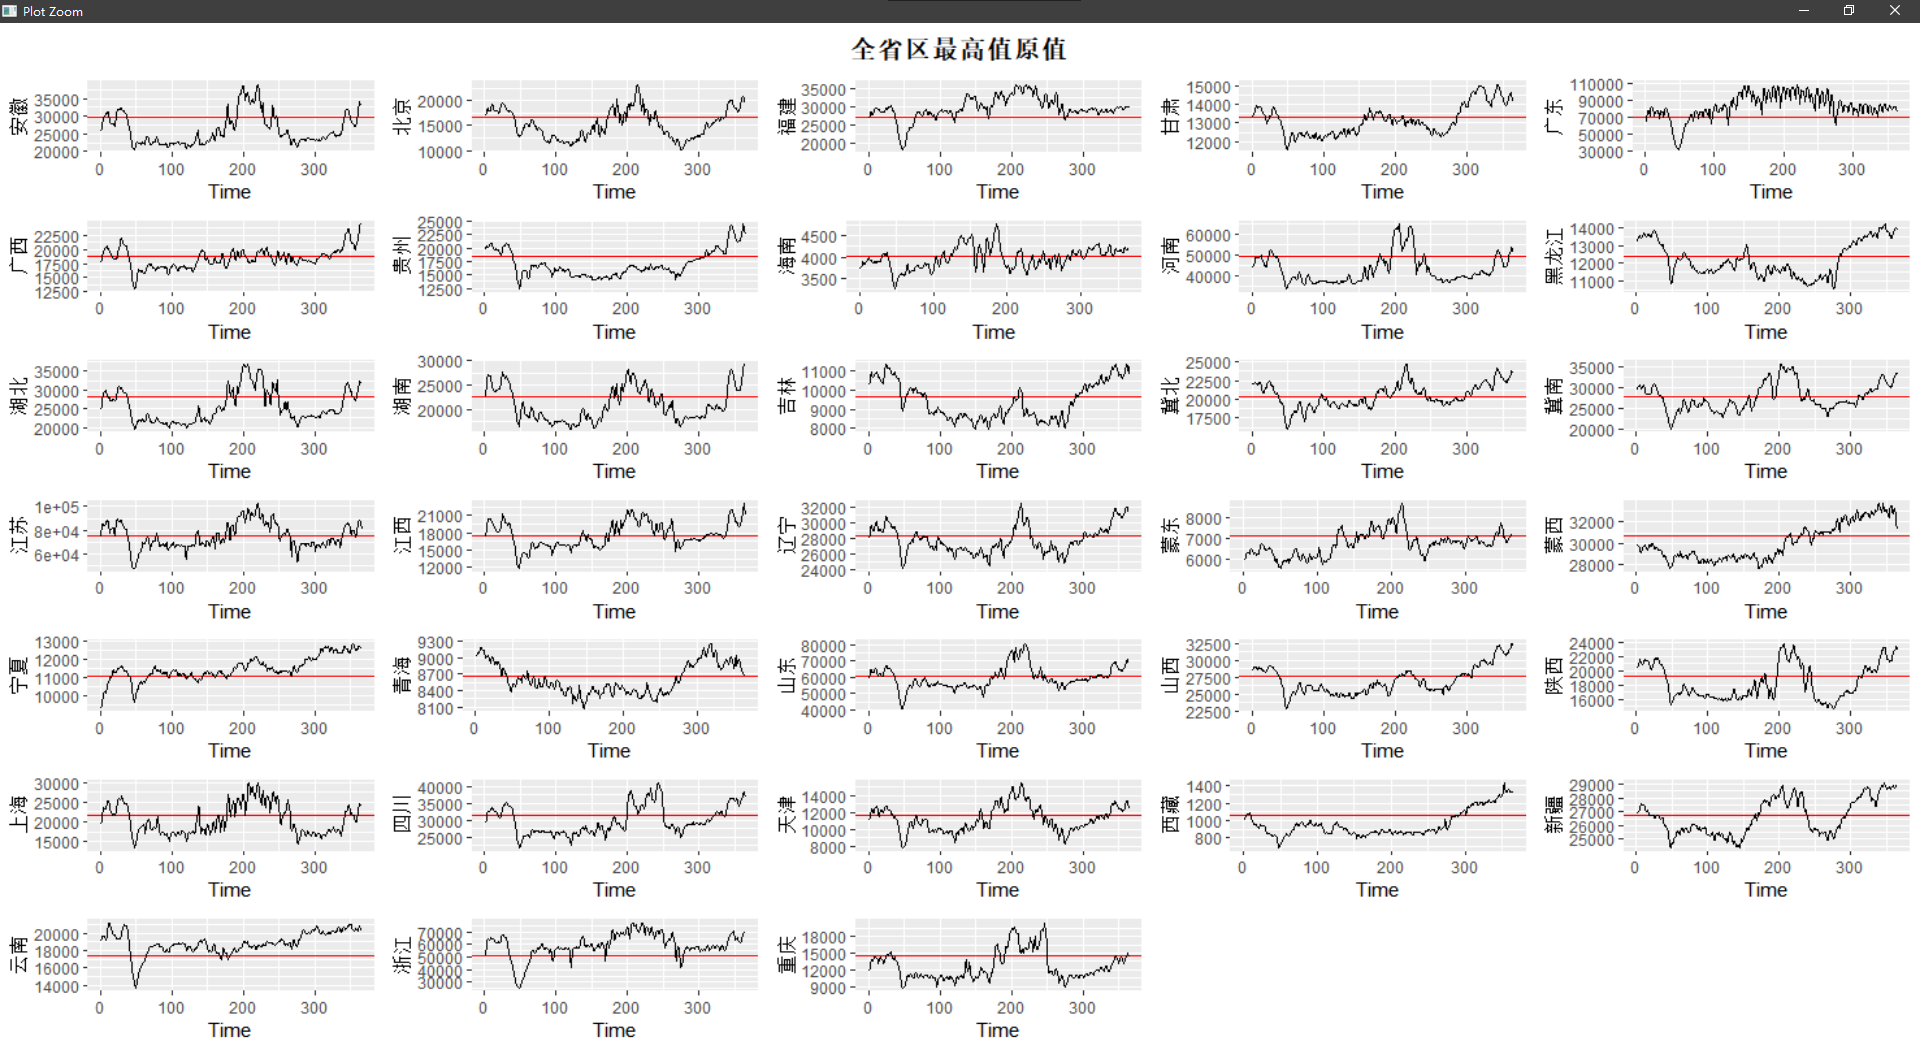
#The original value of the highest value of the province
The last IMF with the highest value in all provinces
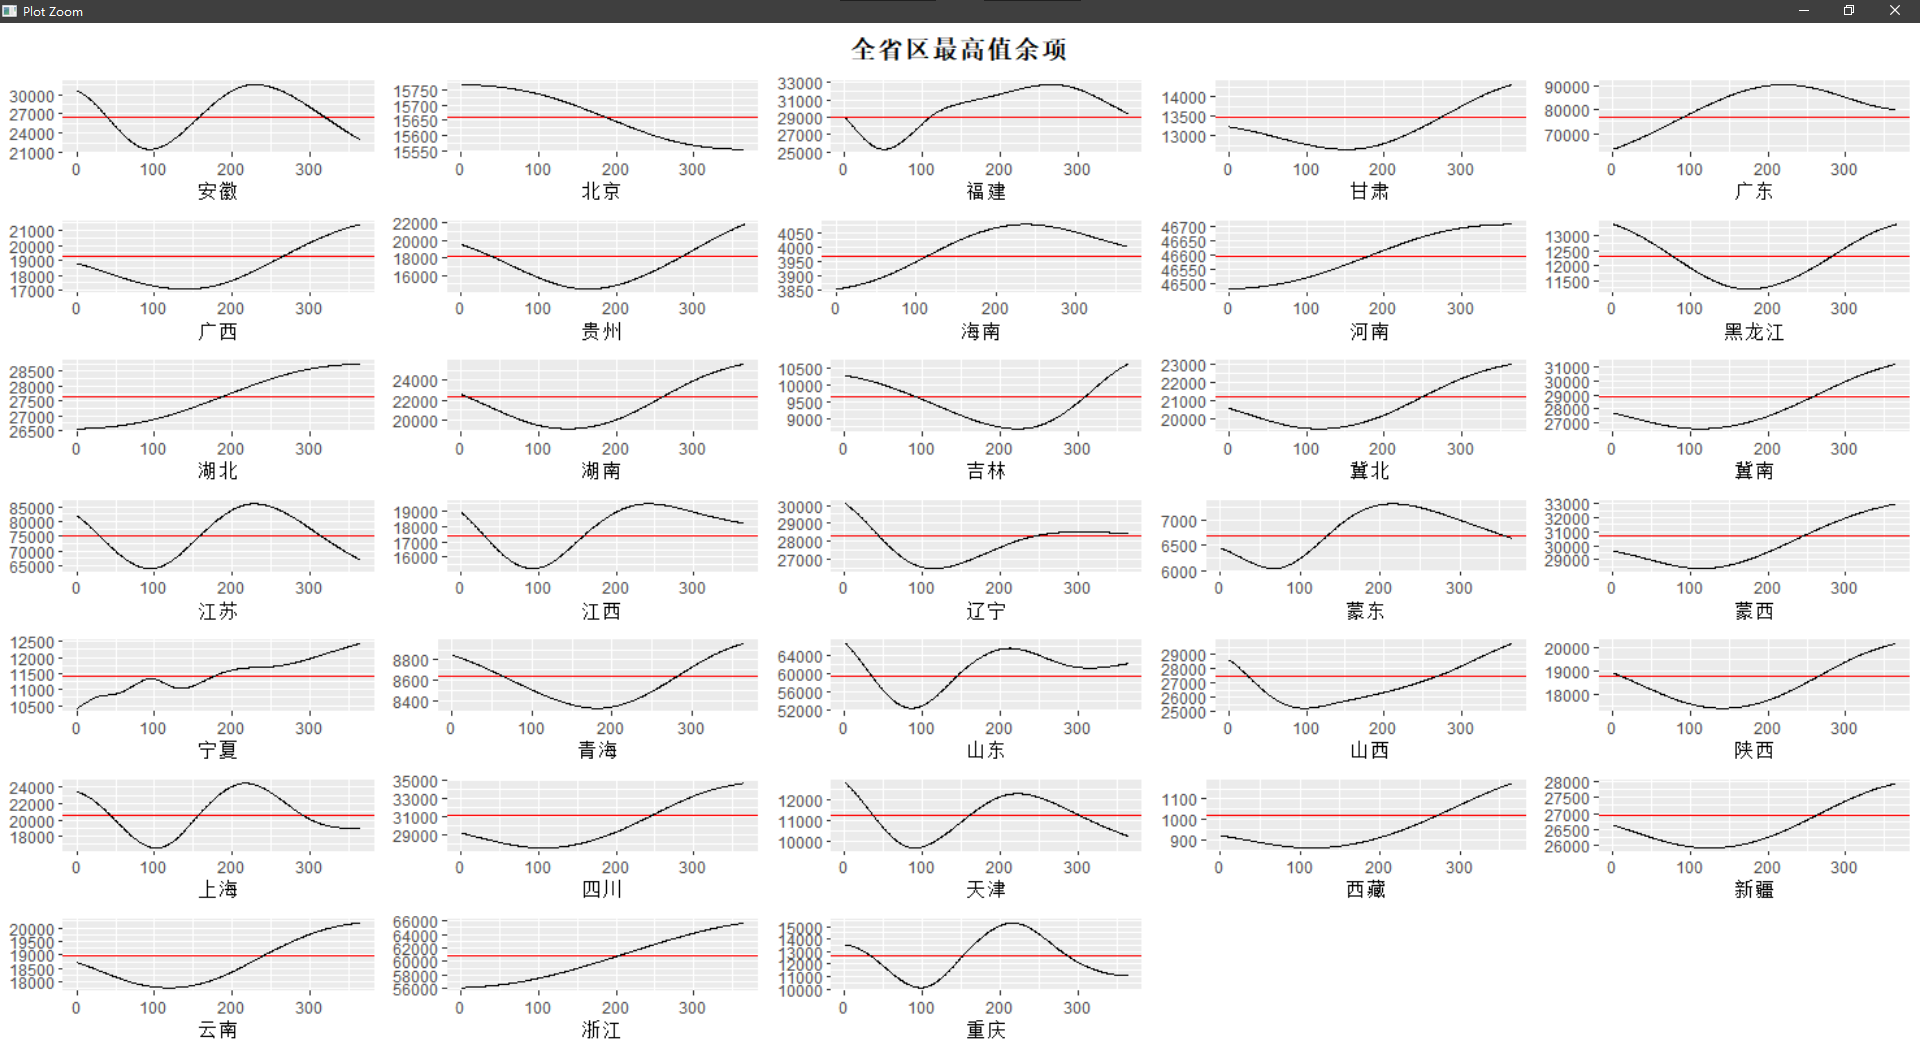
The remaining items with the highest value in all provinces
Intelligent Recommendation
ECG signal denoising 4--empirical simulation decomposition method (EMD)
The previous article in this series (Mathematical Morphology) gives directions: Note: This is a small handheld ECG machine as the research object (single lead) In the previous article, we mentioned th...

EMD empirical modal decomposition related matlab, Python code
Python implementation This is another Python implementation of empirical mode decomposition (EMD). The package contains many EMD variants and intends to deliver more in time. https://github.com/laszuk...
Inherent modal function IMF and empirical modal decomposition EMD
1.Single component signals with specific physical interpretations are called inherent modular functions, Also known asModel function,intrinsic mode function,IMF。 2. Empirical mode decomposition, EMD i...

R-Wave Detection Algorithm Based on ECG Empirical Mode Decomposition
function allmode=emd(Y) % is used for empirical mode decomposition, Y is the data to be decomposed, and allmode is the decomposed mode IMF xsize=length(Y); dd=1:1:xsize; Ystd=std(Y); Y=Y/Ystd; TNM=7;%...
EMD algorithm principle decomposition signal
The SSVEP signal contains spontaneous energy and a large number of external interference signals, belonging to a typical nonlinear non-stationary signal. Traditional filtering methods typically do not...
More Recommendation
EEMD (Ensemble Empirical Mode Decomposition) set empirical mode decomposition code
%function allmode=eemd(Y,Nstd,NE) % % This is an EMD/EEMD program % % INPUT: % Y: Inputted data;1-d data only % Nstd: ratio of the standard deviation of the added noise and that % of Y (0.2-0.3); stan...

[Signal Processing] Empirical Mode Decomposition (Empirical Mode Decomposition)
Empirical Mode Decomposition (EMD) Empirical modal decomposition EMD is based on the concept of instantaneous frequency and intrinsic mode function (IMF), which can decompose complex signals into seve...

Matlab uses empirical mode to decompose emd to denoise the signal
For this example, consider a non-stationary continuous signal consisting of a sine wave with a significant frequency change. The vibration or fireworks sound of a jackhammer is an example of a non-sta...

EMD basic learning---experience mode decomposition explanation
Article Directory 1. Introduction 2. Intensional modal components 3. EMD decomposition process 1. Introduction Empirical mode decomposition(Empirical Mode Decomposition, abbreviated EMD) is composed o...
MATLAB implements EMD (experience mode decomposition)
MATLAB implements EMD (experience mode decomposition) Background: EMD denoising on 8-channel surface electromechanical signal...